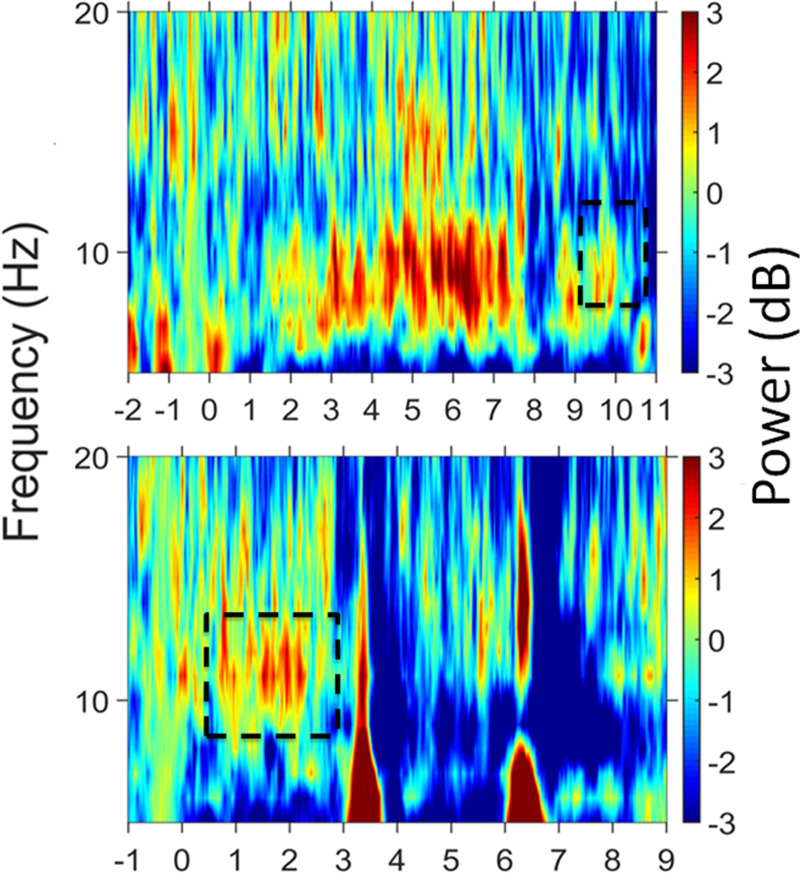
Fig. 2.

Mean change in alpha power across participants and trials. The temperature scale represents changes in event-related band power in decibels (dB). The top panel shows changes in alpha activity during the retention period relative to baseline alpha activity in the recovery period, that is, before the noise is presented. The bottom panel shows changes in alpha activity during the speech presentation period relative to alpha activity during the last second of unmodulated noise, that is, the period of noise alone that preceded the presentation of the first spoken digit. Dashed boxes represent the time periods of increased alpha activity (n =116). The X-axis represents time.
