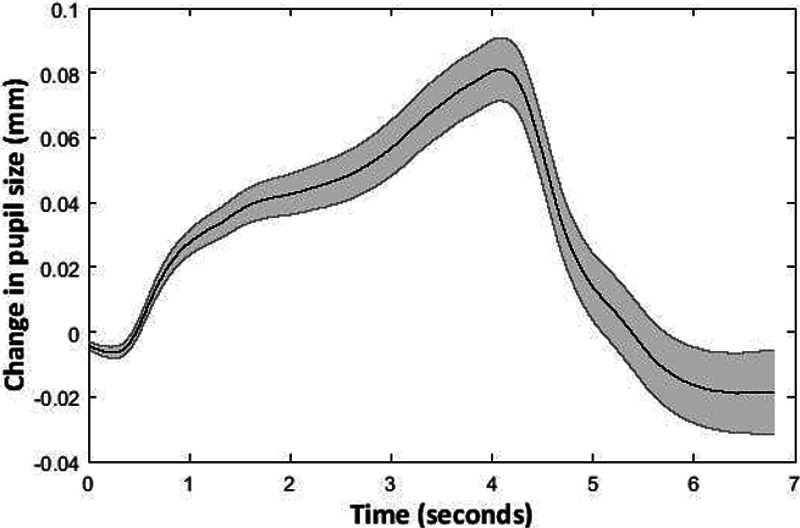
Fig. 4.

Mean change in pupil size relative to baseline across participants and trials. The black line represents mean change in pupil size across participants and trials (y) axis. The shaded gray area represents ±1 SE. (n = 116). Time in seconds (0 to 4 sec: speech presentation period, 4 to 7 sec: retention period) is shown on the x axis.
