. 2019 Aug 23;40(5):1084–1097. doi: 10.1097/AUD.0000000000000697
Copyright © 2019 The Authors. Ear & Hearing is published on behalf of the American Auditory Society, by Wolters Kluwer Health, Inc.
This is an open access article distributed under the Creative Commons Attribution License 4.0 (CCBY), which permits unrestricted use, distribution, and reproduction in any medium, provided the original work is properly cited.
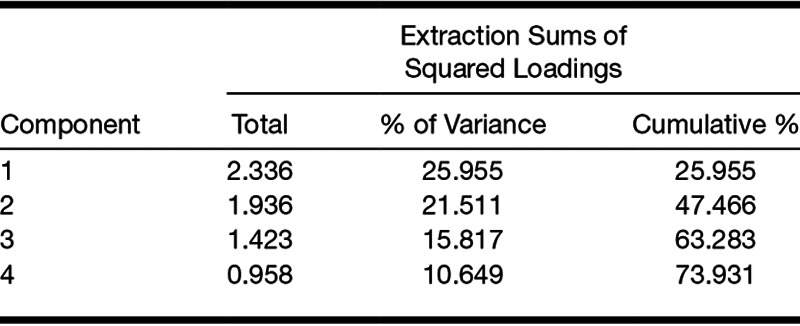
TABLE 4.
Percentage of the variance explained by each factor

