FIGURE 4.

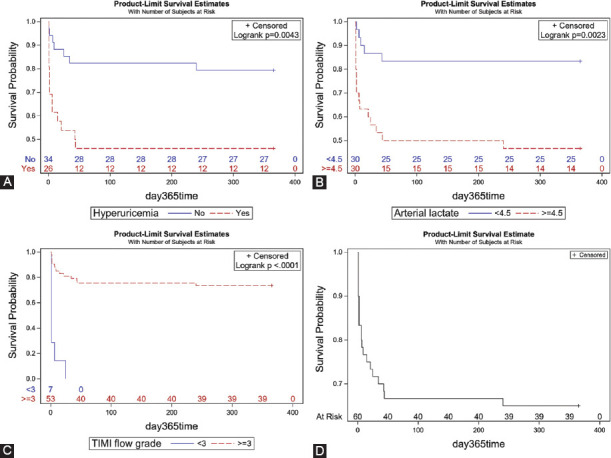
Time-to-event curves of subgroups segregated based on the independent risk factors for 1-year all-cause mortality. (A) Hyperuricemia, (B) arterial lactate, (C) thrombolysis in myocardial infarction (TIMI) flow grade, (D) all patients.

Time-to-event curves of subgroups segregated based on the independent risk factors for 1-year all-cause mortality. (A) Hyperuricemia, (B) arterial lactate, (C) thrombolysis in myocardial infarction (TIMI) flow grade, (D) all patients.