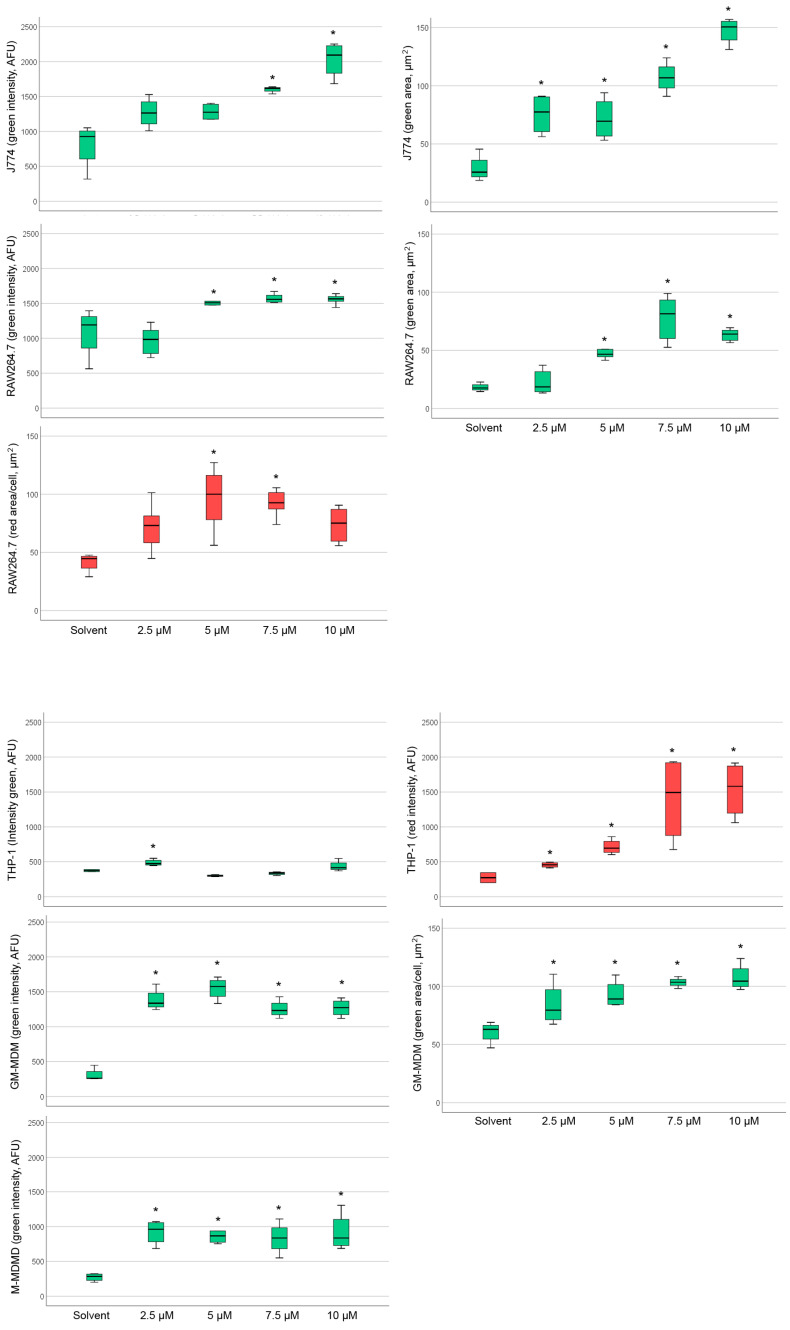
Figure 5.
Changes in intensity and area of the green (phospholipid accumulation) and red (neutral lipid accumulation) channel after exposure to amiodarone (Amio) with significant changes indicated by asterisks. Diagrams of murine macrophages are seen in the upper half and human macrophages in the lower half of the Figure. Boxes represent values within the 25–75% quartiles; the whiskers show values outside this range. Abbreviations: GM-MDM: M1 macrophages; M-MDM, M2 macrophages.

