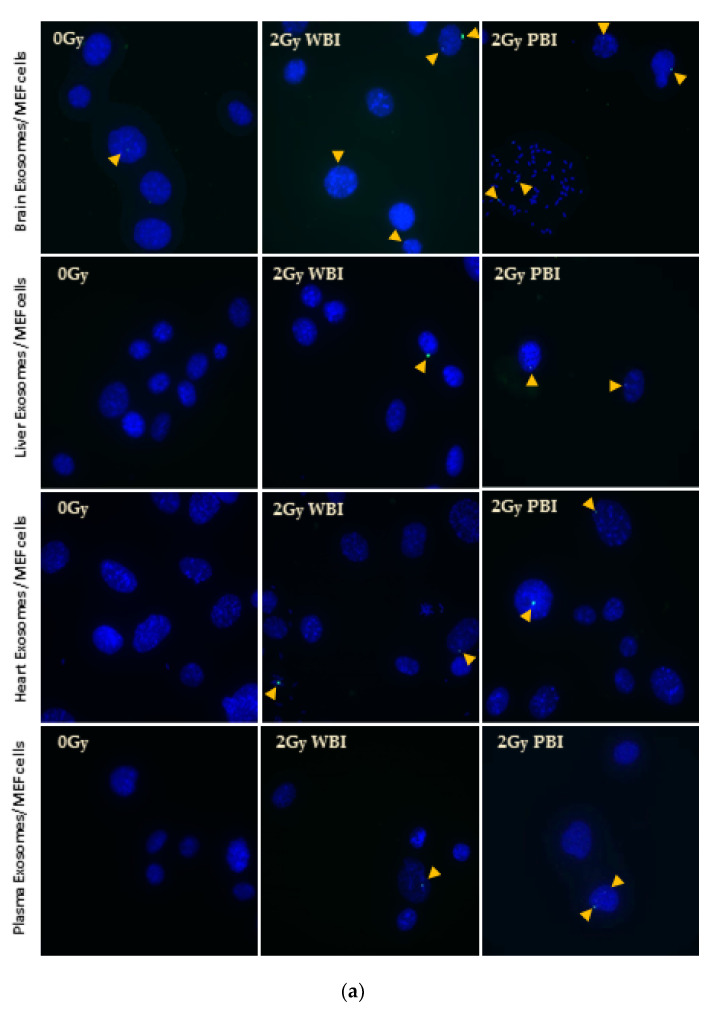
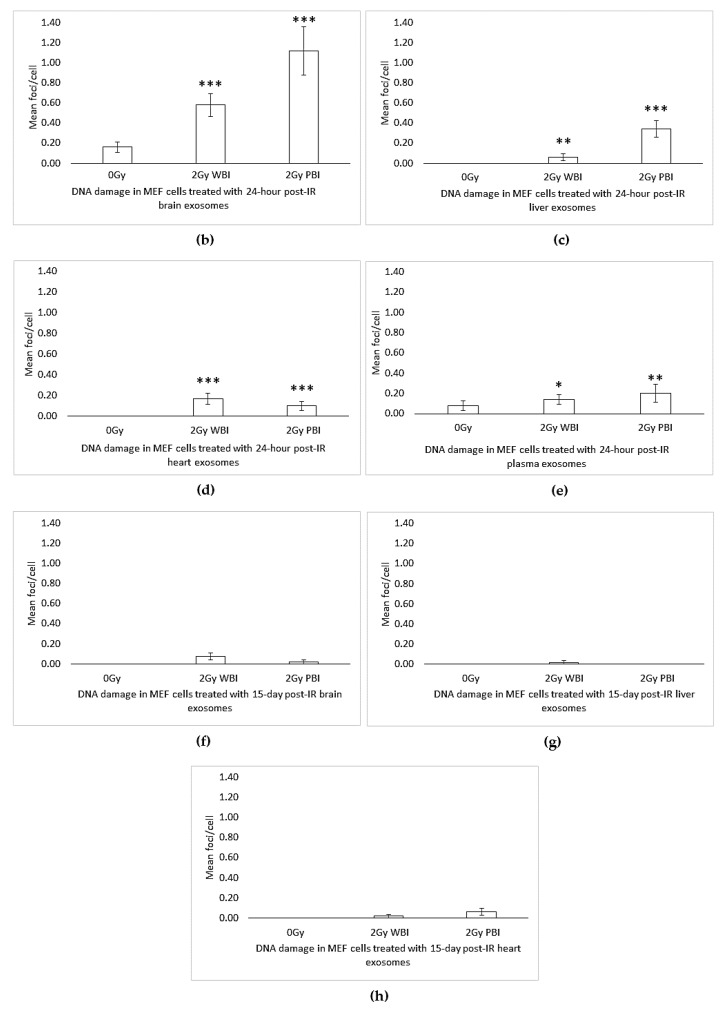
Figure 6.
γH2AX foci formation in MEF cells after 24 h treatment with 24 h and 15 days post-IR organ and plasma of 2 Gy WBI or PBI mouse compared to unirradiated mouse organ exosomes treated cells. (a) Representative 63X fluorescent microscope images of MEF cells. Arrows indicate the location of γH2AX foci (Alexa488), cells were counterstained with 4′,6-Diamidine-2-phenylindole dihydrochloride (DAPI). (b–e) Bars represent the mean γH2AX foci formed per cell ± SEM after treatment with 24 h post-IR exosomes and (f–h) 15 day post-IR exosomes obtained from organs and plasma of 2 Gy WBI or PBI mouse compared to corresponding unirradiated mouse organ and plasma exosomes (* p < 0.05, ** p < 0.01, *** p < 0.001).


