Figure 7.
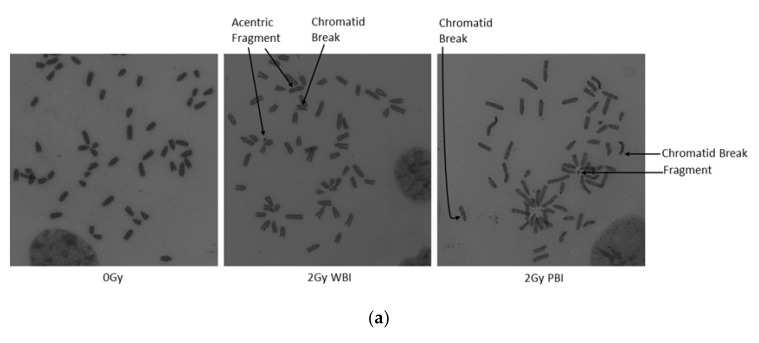
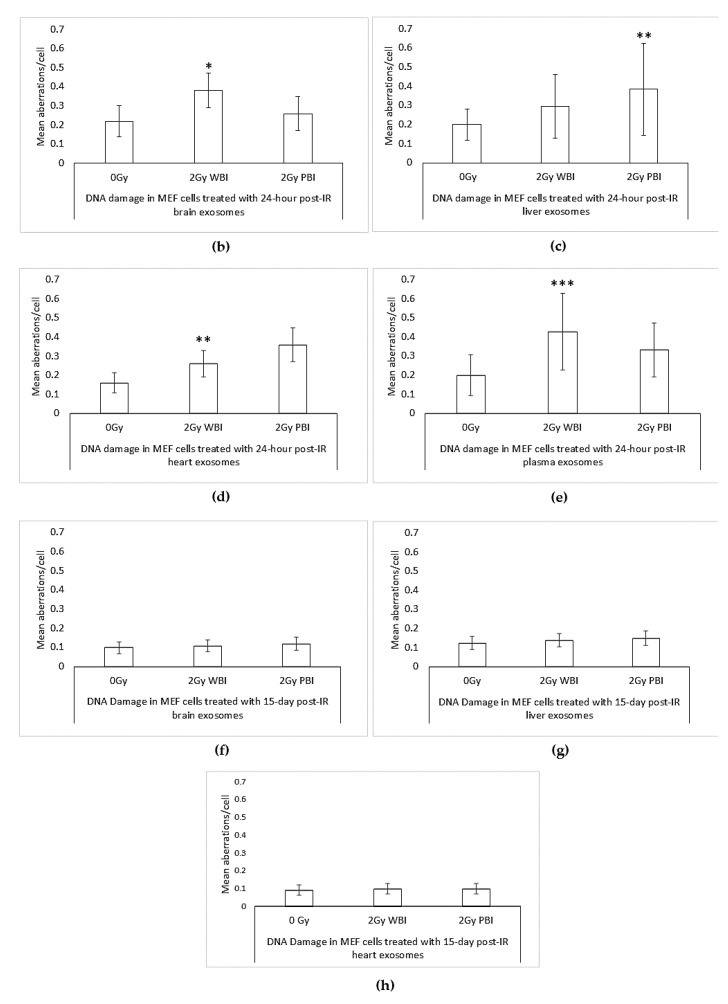
Chromosome analysis of MEF cells treated with 24 h and 15 days post-IR organ and plasma of 2 Gy WBI or PBI mouse compared to unirradiated mouse organ exosomes treated cells. (a) Normal and aberrant metaphase of MEF cells treated with exosomes derived from 24-h post-IR brain exosomes isolated from control (0 Gy), 2 Gy WBI and PBI mouse. Mean chromosomal aberrations/cell in MEF cells treated with (b–e) 24-h and (f–h) 15-day post-IR exosomes obtained from organs and plasma of 2 Gy WBI or PBI mouse compared to corresponding unirradiated mouse organ exosomes. Chromosomal aberrations (total) were scored in 100 metaphase spreads in cells treated with corresponding exosomes for 24 h. Bars represent mean chromosomal aberrations per cell ± SEM, significance was tested by Fisher’s exact test. (* p < 0.05, ** p < 0.01, *** p < 0.001).


