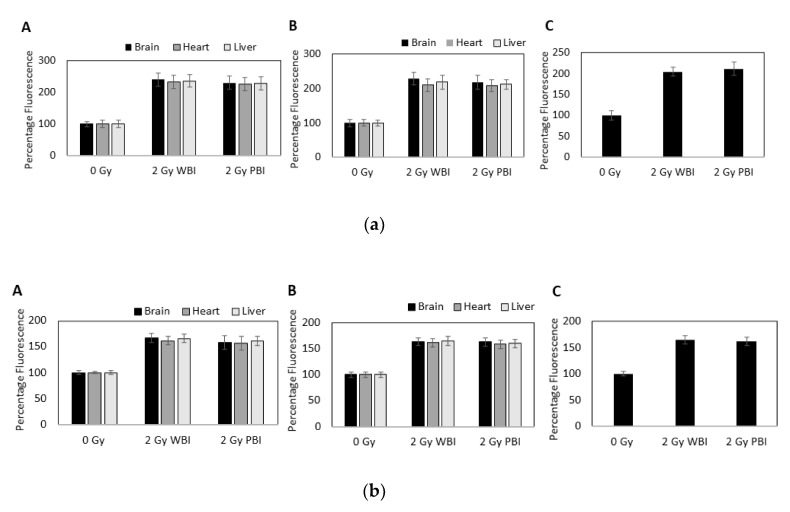
Figure 9.
(a) Intracellular reactive oxygen species (ROS) levels in MEF cells as measured using CM-H2 DCFDA fluorescence after addition of media containing exosomes from brain, heart and liver from mice (A) 24 h and (B) 15 days after whole or partial body irradiation and (C) from plasma from mice 24 h after whole or partial body irradiation. Data are presented as mean ± SD after each sample was normalised to its respective control. (b) Intracellular NO levels in MEF cells as measured using DAF fluorescence after addition of media containing exosomes from brain, heart, and liver from mice (A) 24 h and (B) 15 days after whole or partial body irradiation and (C) from plasma from mice 24 h after whole or partial body irradiation. Data are presented as mean ± SD after each sample was normalised to its respective control.

