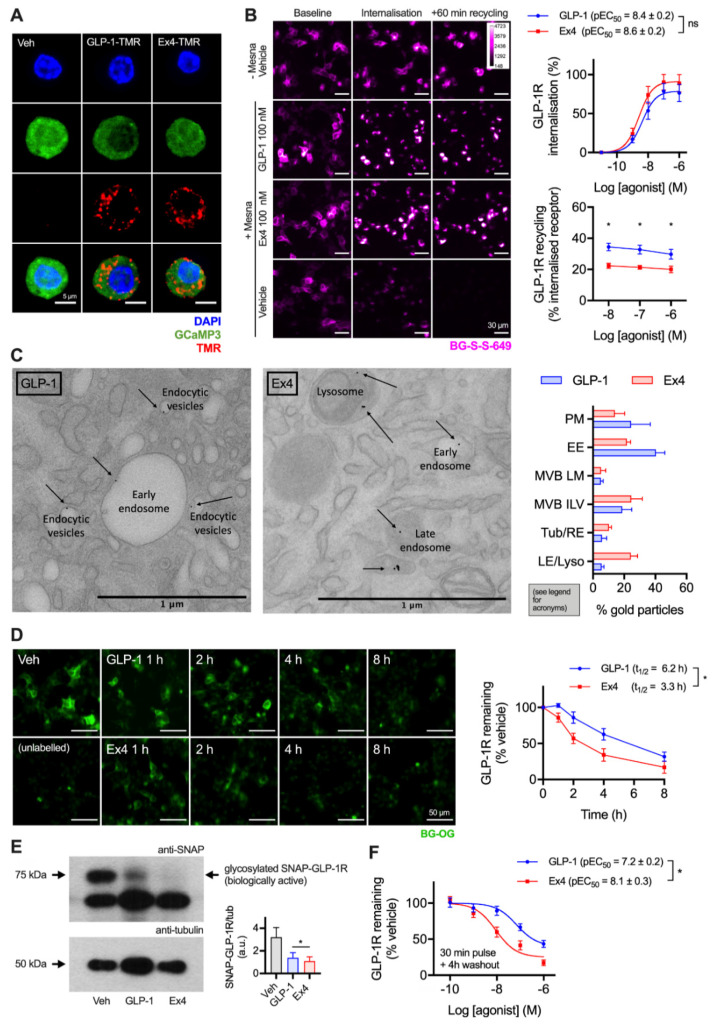
Figure 1.
Accelerated GLP-1R degradation with exendin-4 in beta cells. (A) Endocytic uptake of 100 nM GLP-1-TMR or exendin-4-TMR in GLP-1R-expressing dispersed primary islet cells. GLP-1R-positive cells are marked by GCaMP3 under GLP-1R promoter-driven Cre expression. Representative images from n = 2 mice. Scale bar = 6 µm. The sequences and pharmacological characterisation of GLP-1-TMR and exendin-4-TMR are provided in the Supporting Information (Supplementary Figure S1). (B) Assessment of GLP-1R trafficking in INS-1-SNAP-GLP-1R cells using high content microscopy. Representative images and quantification of GLP-1R internalisation (30 min) and recycling (60 min) from n = 5 experiments is shown, with internalisation pEC50 compared by paired t-test, and recycling results compared by two-way randomised block ANOVA with Sidak’s test. Scale bar = 30 µm. (C) Example electron micrographs in MIN6B1-SNAP-GLP-1R cells labelled with BG-S-S-biotin and streptavidin-gold (10 nm) and treated with 100 nM exendin-4 and GLP-1 for 1 h. Quantification of gold particle distribution from n = 3 experiments comprising plasma membrane (PM), early endosomes (EE), multivesicular body limiting membrane (MVB LM) or intraluminal vesicles (ILV), recycling endosomes or tubules (Tub/RE) and late endosomes or lysosomes (LE/Lyso). Scale bar = 1 µm. (D) Time-course for GLP-1R degradation in INS-1-SNAP-GLP-1R cells treated with cycloheximide (50 µg/mL) in serum-free medium ± 10 nM agonist, applied in reverse time order, followed by BG-OG labelling (0.5 µM) for the final 30 min of the study. Representative images and quantification from n = 4 experiments are shown, with t1/2 quantified by 1-phase exponential curve fitting and compared by paired t-test. Scale bar = 50 µm. (E) Western blot analysis and quantification of GLP-1R degradation in INS-1-SNAP-GLP-1R cells after treatment for 6 h in serum-free medium supplemented with 50 µg/mL cycloheximide in the presence or absence of 10 nM GLP-1 or exendin-4, quantification from n = 4 experiments and comparison by paired t-test. (F) GLP-1R degradation in INS-1-SNAP-GLP-1R cells pre-treated with cycloheximide (50 µg/mL) in serum-free medium for 60 min before application of agonist for 30 min, followed by washout and 4 h incubation; 3-parameter fit of data from n = 5 experiments. * p < 0.05 by statistical test indicated. Data represented as mean ± SEM.

