Figure 4.
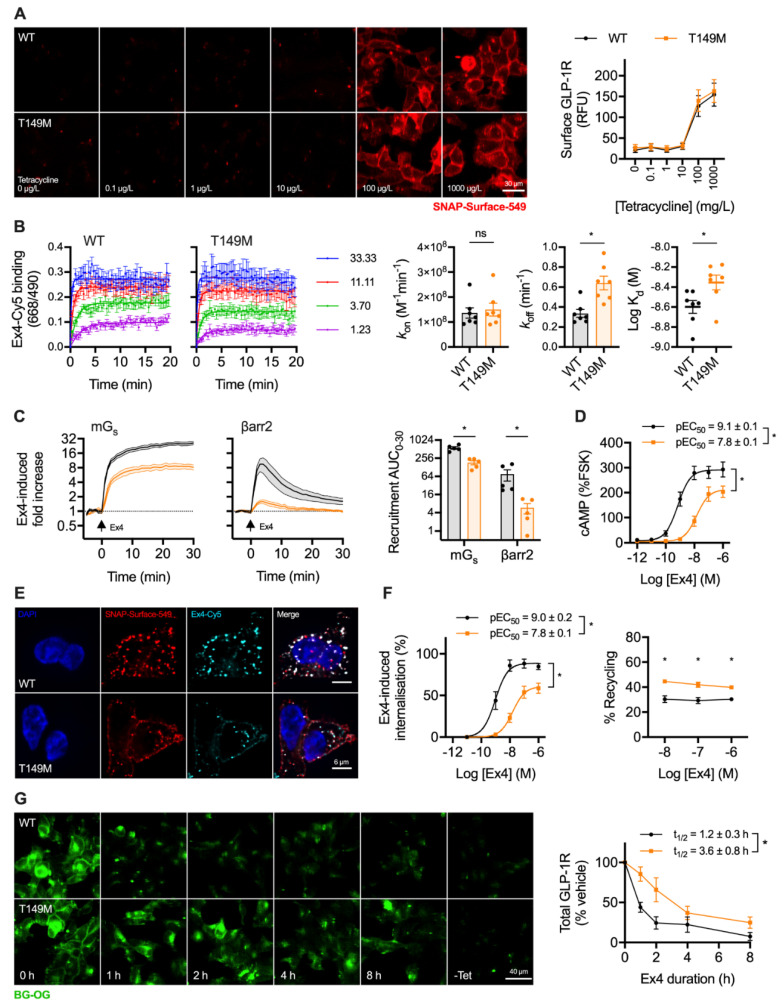
Trafficking and signalling with the T149M GLP-1R variant. (A) Tetracycline-induced expression of wild-type and T149M SNAP-GLP-1R in stably transfected Flp-In 293-T-REx cells, with quantification from n = 5 experiments; scale bar = 30 µm. (B) Assessment of kinetic binding parameters of exendin-4-C39-Cy5 in 293-T-Rex-GLP-1R cells, n = 7, with comparisons by paired t-test. (C) Recruitment of mini-Gs (mGs) and β-arrestin-2 (βarr2) in response to 100 nM exendin-4, assessed by nanoBiT complementation, n = 5, with AUC quantification and comparison by paired t-test. (D) cAMP responses to exendin-4 in 293-T-REx-GLP-1R cells, normalised to 10 µM forskolin (FSK), n = 5, with pEC50 and Emax compared by paired t-tests. (E) GLP-1R internalisation and uptake of exendin-4-C39-Cy5 uptake in 293-T-REx-GLP-1R stimulated for 30 min, representative images of n = 3 experiments; scale bars = 6 µm. (F) Quantification of GLP-1R internalisation and recycling by high content microscopy in 293-T-REx-GLP-1R cells, n = 5, with internalisation pEC50 and Emax compared by paired t-tests, and recycling results compared by two-way randomised block ANOVA with Sidak’s test. (G) GLP-1R degradation in 293-T-REx-GLP-1R cells stimulated with 100 nM exendin-4 and subsequently labelled with BG-OG (0.5 µM), with representative images and quantification from n = 5 experiments, with t1/2 compared by paired t-test. * p < 0.05 by statistical test indicated. Data represented as mean ± SEM.

