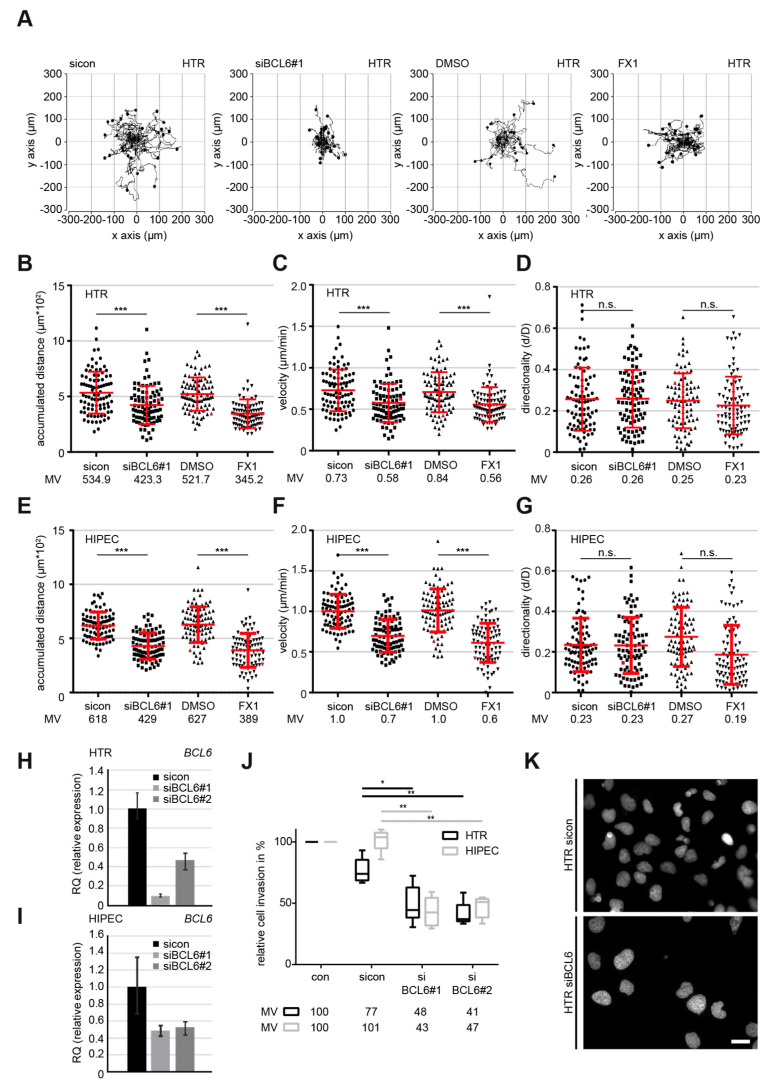
Figure 2.
Inhibition of BCL6 reduces the motility of first trimester trophoblastic cells. (A–D) Time-lapse microscopy was performed with HTR cells, depleted of BCL6 with siBCL6#1 or treated with the BCL6 inhibitor FX1 for up to 12 h. The random motility of these cells was analyzed. Representative trajectories of individual cells (n = 30) are shown (A). The evaluated accumulated distance (B), velocity (C), and directionality (D) from three independent experiments are presented as scatter plots with variations. *** p < 0.001, * p < 0.05 and, n.s. p > 0.05. (E–G) Time-lapse microscopy was performed with HIPEC cells, depleted of BCL6 with siBCL6#1 or treated with the BCL6 inhibitor FX1 for up to 12 h. The random motility of these cells was analyzed. The evaluated accumulated distance (E), velocity (F), and directionality (G) from three independent experiments are shown as scatter plots with variations. *** p < 0.001. (H–K) Invasion assay. HTR or HIPEC cells were treated with sicon or siBCL6#1, seeded into Transwell systems, and starved for 12 h. The cells were released into fresh medium for 24 h and fixed for quantification. The BCL6 gene levels were measured in HTR (H) or HIPEC cells (I) as transfection efficiency controls. Representatives of invaded HTR cells are shown (K). Scale: 25 μm. Invaded cells were quantified. The total number of invaded cells in the control group was assigned as 100%. The results were obtained from three independent experiments and are presented as the mean ± SEM (J). ** p < 0.01.

