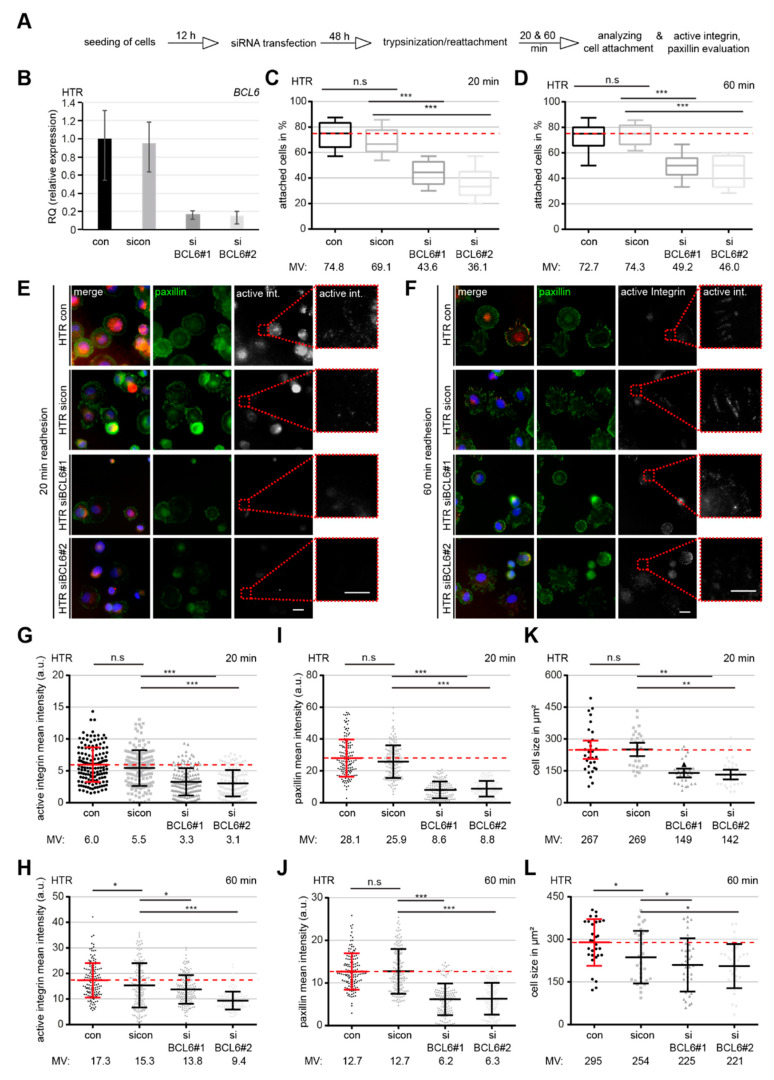
Figure 3.
Cell adhesion and integrin activation are compromised upon BCL6 depletion. (A) Schedule of the cell spreading/adhesion assay. HTR cells were treated with sicon, siBCL6#1, or siBCL6#2. Forty-eight hours later, treated cells were trypsinized and reseeded for 20 or 60 min for a further evaluation of attached cells or for immunofluorescence staining. (B) The BCL6 gene levels were measured in treated cells as transfection efficiency controls. (C) Evaluation of attached cells at 20 min after reseeding (300 cells). The results are based on three independent experiments and presented as box plots. *** p < 0.001. (D) Quantification of attached cells at 60 min after reseeding. The results were obtained from three independent experiments and are shown as box plots, with bars indicating variable sizes (300 cells). *** p < 0.001. (E,F) Attached cells at 20 min (E) and 60 min (F) after reseeding were also stained for focal adhesion (FA) markers paxillin and active integrin, as well as DNA, for evaluation. Scale: 25 μm, inset scale: 20 μm. (G,H) Relative intensity of paxillin was evaluated at 20 min (G) and 60 min (H) after reseeding (280 FAs for each condition). The data were obtained from three independent experiments and are presented as scatter plots with variations. The red dashed line depicts the relative intensity measured in control cells. (I,J) Relative intensity of active integrin was evaluated at 20 min (I) and 60 min (J) after reseeding (280 FAs for each condition). The results were derived from three independent experiments and are presented as scatter plots with variations. The red dashed line depicts the intensity measured in control cells. (K,L) The relative cell size was evaluated at 20 min (K) and 60 min (L) after reseeding (30 cells for each condition). The data were obtained from three independent experiments and are shown as scatter plots with variations. The red dashed line depicts the relative cell size measured in control cells. For G–L: *** p < 0.001, ** p < 0.01, * p < 0.05 and, n.s. p > 0.05.

