Figure 5.
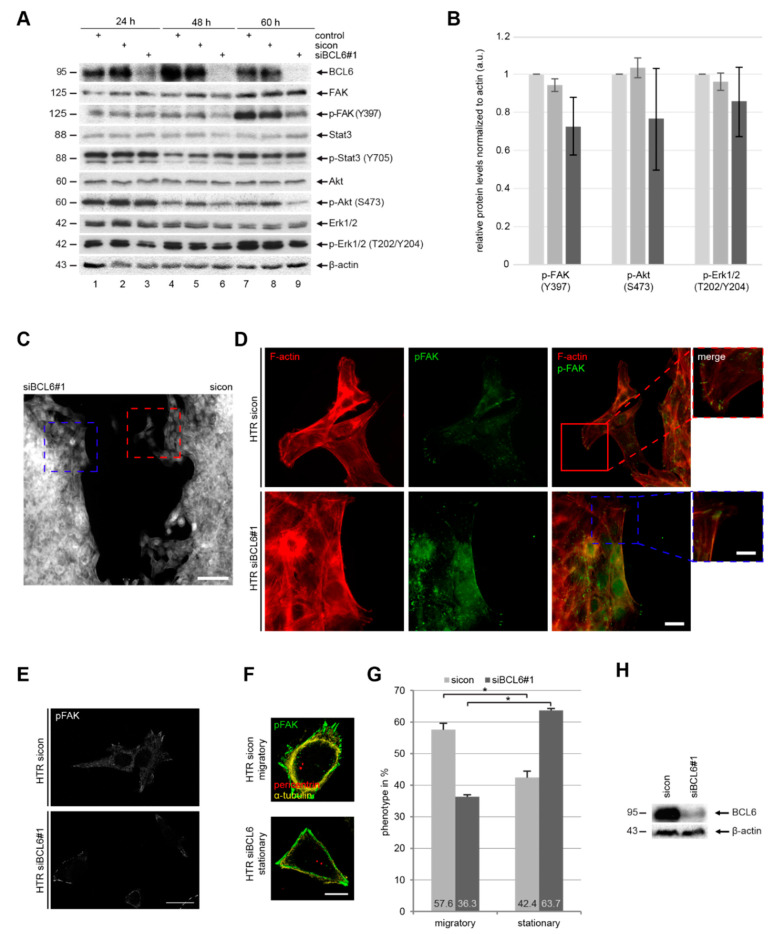
Deficiency of BCL6 weakens the activation of multiple signaling pathways. (A) HTR cells were treated with sicon or siBCL6#1 for indicated time points. Cellular extracts were prepared for Western blot analyzes with indicated antibodies. β-actin served as the loading control. (B) The relative ratios are depicted in this graph and the results are based on three independent experiments and presented as the mean ± SEM. (C,H) HTR cells depleted of BCL6 (H) and sicon cells were seeded for the wound healing/migration assay. Twelve hours later, cells were stained for F-actin (white). A representative overview of both migration fronts of two different cell conditions is shown. Scale: 300 µm. (D) Magnified representative images (sicon: red and siBCL6#1: blue) of the migration fronts are shown with indicated antibodies. Scale: 25 µm, inset scale: 12.5 µm. (E) HTR cells depleted of BCL6 (A) were also stained for p-FAK (white). Scale: 30 µm. Representative migratory and stationary HTR cells are shown (F). Scale: 25 µm. These two types of HTR cells were quantified (300 cells for each condition) and the results are based on three independent experiments and presented as the mean ± SEM (G). * p < 0.05.

