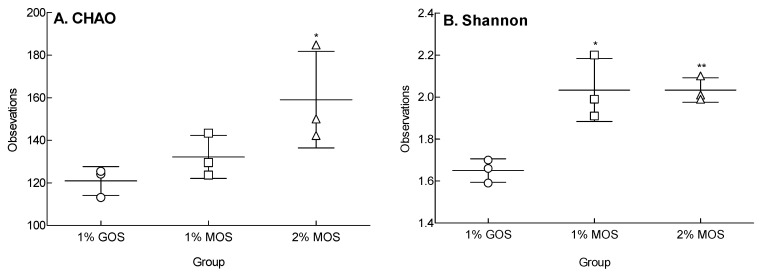
Figure 5.
Alpha diversity of the three groups, 1% GOS, 1% MOS, and 2% MOS. The species richness (A) and species diversity (B) were evaluated by CHAO and Shannon indexes. The 1% GOS: Group fermented with fecal microbes by adding 1% galacto-oligosaccharide (GOS) to the basal medium; 1% MOS: Group fermented with fecal microbes by adding 1% malto-oligosaccharide (MOS) to the basal medium; 2% MOS: Group fermented with fecal microbes by adding 2% MOS to the basal medium. Data are expressed as the mean ± standard deviation, and different symbols indicate significant differences at * p < 0.05 and ** p < 0.01 vs. the GOS group.

