
FIGURE 3.
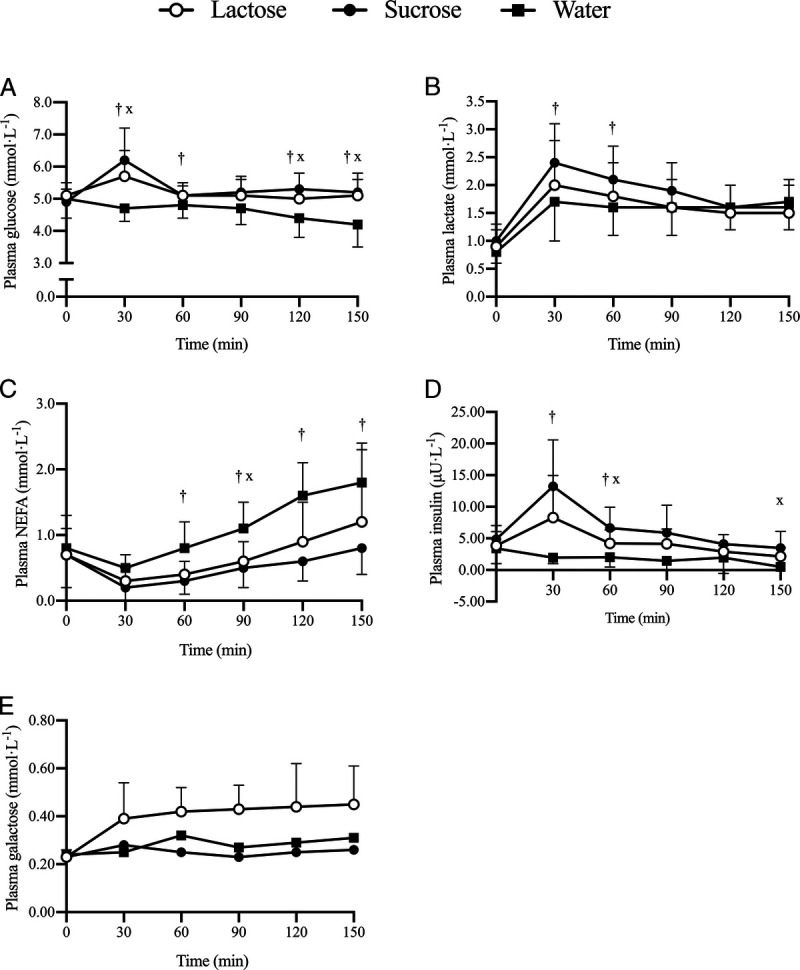
Plasma glucose (A), lactate (B), NEFA (C), insulin (n = 8) (D), and galactose (E) concentrations between 30 and 150 min of cycling at 50% Wmax, ingesting lactose, sucrose, or water. *A significant difference (P < 0.05) between lactose and sucrose at this time point. xA significant difference (P < 0.05) between lactose and water at this time point. †A significant difference (P < 0.05) between sucrose and water at this time point.