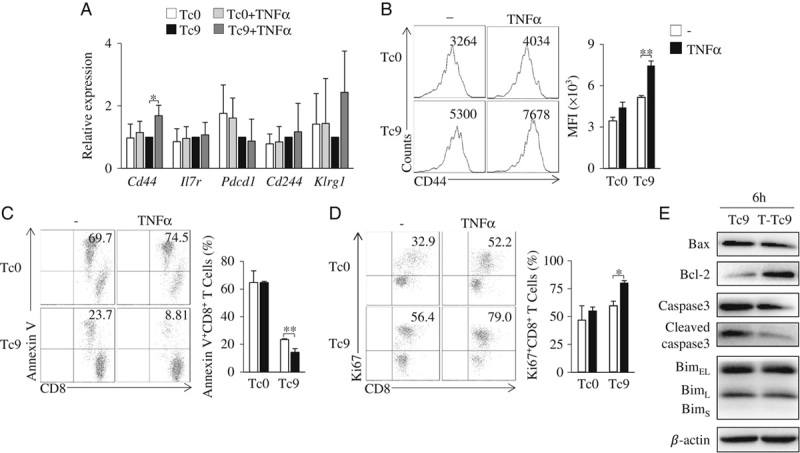
FIGURE 2.

TNF-α increases the survival and proliferation of Tc9 cells in vitro. A–D, Mouse Tc9 cells were generated in the cultures in the presence or absence of TNF-α for 2 days. Tc0 cells were used as controls. A, Quantitative polymerase chain reaction analysis of the indicated molecules in CD8+ T cells. Expression was normalized to Gapdh and set at 1 in Tc9 cells. B, Flow cytometry analysis of CD44 on CD8+ T cells. Numbers in the histograms represent the fluorescence intensity (FI) of CD44. Right, summarized results of 3 independent experiments obtained as at left. Flow cytometry analysis of Annexin V+CD8+ (C) and Ki67+CD8+ (D) T cells. Numbers in the histograms represent the percentages of the double-positive T cells. Right, summarized results of 3 independent experiments obtained as at left. E, Naive CD8+ T cells were cultured under Tc9-polarizing conditions with or without the addition of TNF-α for 6 hours. Western blots examined the protein levels of Bax, Bcl-2, caspase3, cleaved caspase3, and Bim in T cells. β-actin was used as a loading control. Data are representative of 3 (B–E) independent experiments or presented as mean±SD of 3 (A–D) independent experiments. *P<0.05; **P<0.01. IL indicates interleukin; MFI, mean fluorescence intensity; TNF, tumor necrosis factor.
