
FIGURE 3.
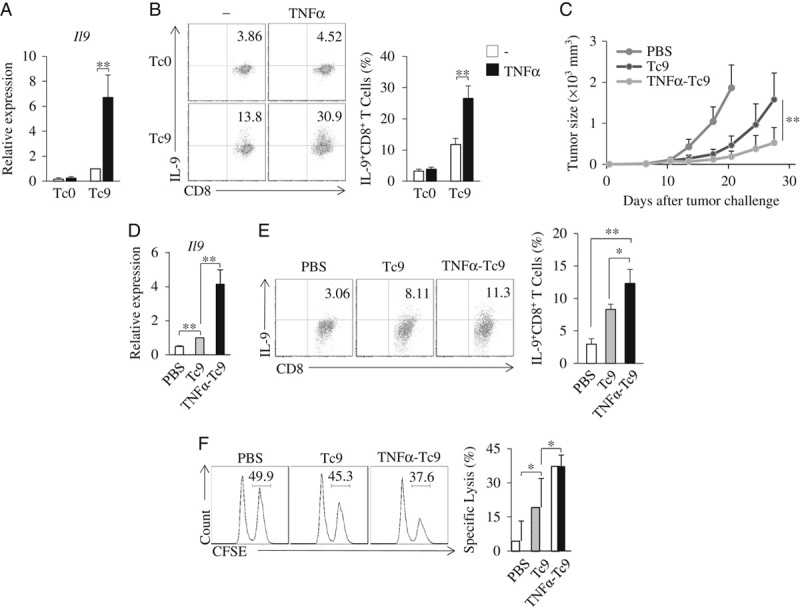
TNF-α increases Tc9 cell antitumor efficacy in vivo. A and B, Naive CD8+ T cells from OT-I mice were cultured under Tc9-polarizing conditions in the presence or absence of TNF-α for 2 days. A, Quantitative polymerase chain reaction analysis of Il9 in T cells. B, Flow cytometry analysis of IL-9+CD8+ T cells. Numbers in the dot plots represent the percentages of IL-9+CD8+ T cells. C, C57BL/6 mice were injected subcutaneously with 2×10⁵ B16-OVA cells. On day 5 after tumor challenge, the B16-OVA tumor-bearing mice were randomly divided into 3 groups with 5 mice per group. Naive CD8+ T cells from OT-I mice were cultured under Tc9-polarizing conditions in the presence or absence of TNF-α for 2 days. Tc9 or TNFα-treated Tc9 cells were injected intravenously into the B16-OVA tumor-bearing mice (1×10⁶ cells/mouse). Mice treated by PBS served as controls. Experiments were repeated twice. Shown are the tumor growth curves. Results are presented as mean±SD of the combined data from 2 independent experiments (n=10/group). D and E, B16-OVA cells (2×10⁶/mouse) were injected intravenously into C57BL/6 mice. Naive CD8+ T cells from OT-I mice were cultured under Tc9-polarizing conditions in the presence or absence of TNF-α for 2 days. On day 5 after tumor injection, mice received Tc9 cells or TNFα-treated Tc9 cells via tail vein injection (1×10⁶ cells/mouse). Mice that received PBS were used as controls. On day 2 after T-cell transfusion, cells were isolated from the lung tumor tissues. D, Quantitative polymerase chain reaction analysis of Il9 in T cells. E, Flow cytometry analysis of IL-9+CD8+ T cells. Numbers in the dot plots represent the percentages of IL-9+CD8+ T cells. F, In vivo CTL assay. CFSEhi target cells and CFSElo nontarget cells were mixed at 1:1 ratio and injected into the tail veins of C57BL/6 mice with Tc9 or TNFα-Tc9 cells generated from OT-I mice. Mice treated with labeled cells and PBS served as controls. After 6 hours, splenocytes were collected and flow cytometry analyzed the CFSE-labeling cells. Numbers in the histograms represent percentages of CFSEhi target cells. Right, summarized specific lysis results of 3 independent experiments obtained as at left. Data are representative of 3 (B, E, F) independent experiments or presented as mean±SD of 3 (A, B, D–F) independent experiments. *P<0.05; **P<0.01. CFSE indicates carboxyl-fluorescein diacetate, succinimidyl ester; IL, interleukin; PBS, phosphate-buffered saline; TNF, tumor necrosis factor.