FIGURE 4.

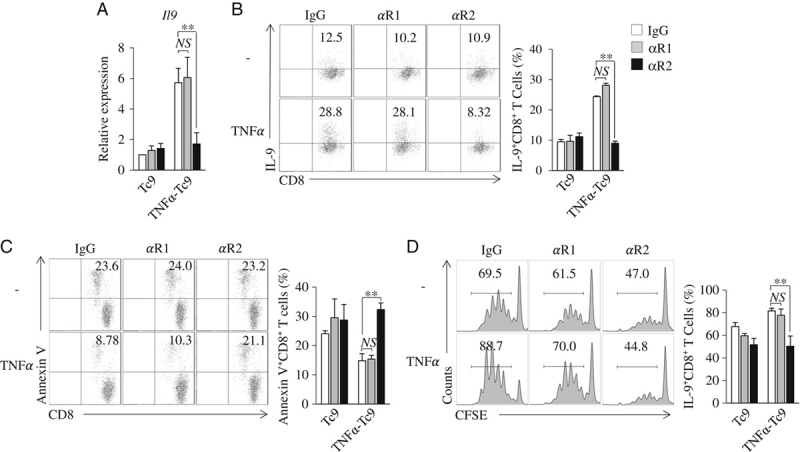
TNF-α drives Tc9-cell differentiation through TNFR2. A–C, CD8+ naive T cells were cultured under Tc9-polarizing conditions in the presence of TNFR1 (αR1) or TNFR2 (αR2)-blocking antibodies or an isotype control IgG with or without (−) the addition of TNF-α for 2 days. A, Quantitative polymerase chain reaction analysis of Il9 expression in CD8+ T cells. Expression was normalized to Gapdh and set at 1 in Tc9 cells. B, Flow cytometry analysis of IL-9+CD8+ T cells. Numbers in the dot plots represent the percentages of IL-9+CD8+ T cells. Right, summarized results of 3 independent experiments obtained as at left. C, Flow cytometry analyzed Annexin V+CD8+ T cells. Numbers in the histograms represent the percentages of Annexin V+CD8+ T cells. Right, summarized results of 3 independent experiments obtained as the left. D, Naive CD8+ T cells were labeled with CFSE and cultured under Tc9-polarizing conditions in the presence of TNFR1 (αR1) or TNFR2 (αR2)-blocking antibodies or an isotype control IgG with or without (−) addition of TNF-α for 2 days. Flow cytometry analyzed CFSE-stained T cells. Numbers in the histograms represent the percentage of CFSE-stained T cells. Right, summarized results of 3 independent experiments obtained as the left. Data are representative of 3 (B–D) independent experiments or presented as mean±SD of 3 (A–D) independent experiments. **P<0.01. CFSE indicates carboxyl-fluorescein diacetate, succinimidyl ester; Ig, immunoglobulin; IL, interleukin; NS, nonsignificant; TNF, tumor necrosis factor.
