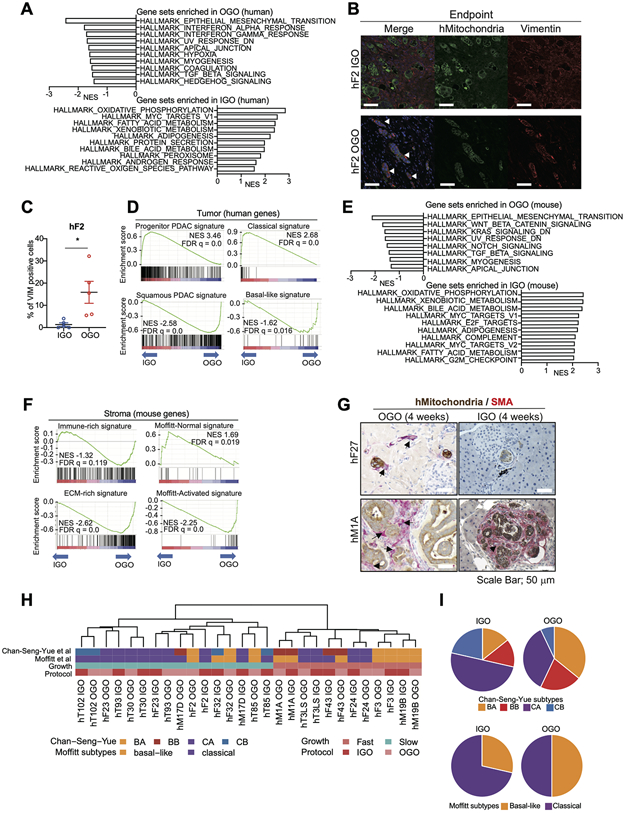
Figure 2. Molecular features of IGO model and OGO model.

A) Hallmark pathways found significantly enriched by GSEA among genes differentially expressed in tumor cells of OGO tumors relative to IGO tumors. 10 gene sets with high Normalized Enrichment Score (NES) are shown. False Discovery Rate (FDR) q values of all gene sets are less than 0.25.
B) Representative IF staining for hMitochondria (green) and Vimentin (red) of tumors generated from IGO (top panels) and OGO (bottom panels) transplants of hF2. Scale bars, 100 μm.
C) Quantification of the percent of Vimentin-positive cells in the IF stains of h2 IGO and OGO transplants as described in (B). Data are means SEMs (n = 5 fields of view). P value, unpaired Student’s t test.
D) Enrichment of Progenitor PDAC signature (top left), Classical signature (top right), Squamous PDAC signature (bottom left) and Basal-like signature (bottom right) by GSEA among genes more highly expressed in tumor cells of IGO tumors and OGO tumors, respectively. NESs and FDR q values are shown.
E) Hallmark pathways found significantly enriched by GSEA among genes differentially expressed in stromal cells of OGO tumors relative to IGO tumors. Gene sets with high NES are shown. FDR q values of all gene sets are less than 0.25.
F) Enrichment of Progenitor PDAC signature (top left), Classical signature (top right), Squamous PDAC signature (bottom left) and Basal-like signature (bottom right) by GSEA among genes more highly expressed in stromal cells of IGO tumors and OGO-tumors, respectively. NESs and FDR q values are shown.
G) Co-IHC staining for hMitochondria (brown) and α-SMA (red) in pancreata of mice transplanted with hF27 or hM1A OGO (left panels) or IGO (right panels) xenografts, 4 weeks after transplantation. Black arrows, fibroblasts. Black arrow head, desmoplastic reaction. Scale bars, 50 μm.
H) Heatmap showing Chan-Seng-Yue (top bar) and Moffitt (second top bar) transcriptional subtypes in IGO and OGO transplants of the indicated organoid lines. BA, Basal-like-A; BB, Basal-like-B: CA, Classical-A; CB, Classical-B. Pink and blue horizontal bar (second bottom) indicates Fast- and Slow-progressor organoids, respectively. Red and pink horizontal bar (bottom) indicates IGO and OGO transplants, respectively.
I) Pie charts showing the proportions of the Chan-Seng-Yue (top) and Moffitt (bottom) transcriptional subtypes in IGO and OGO transplants.
