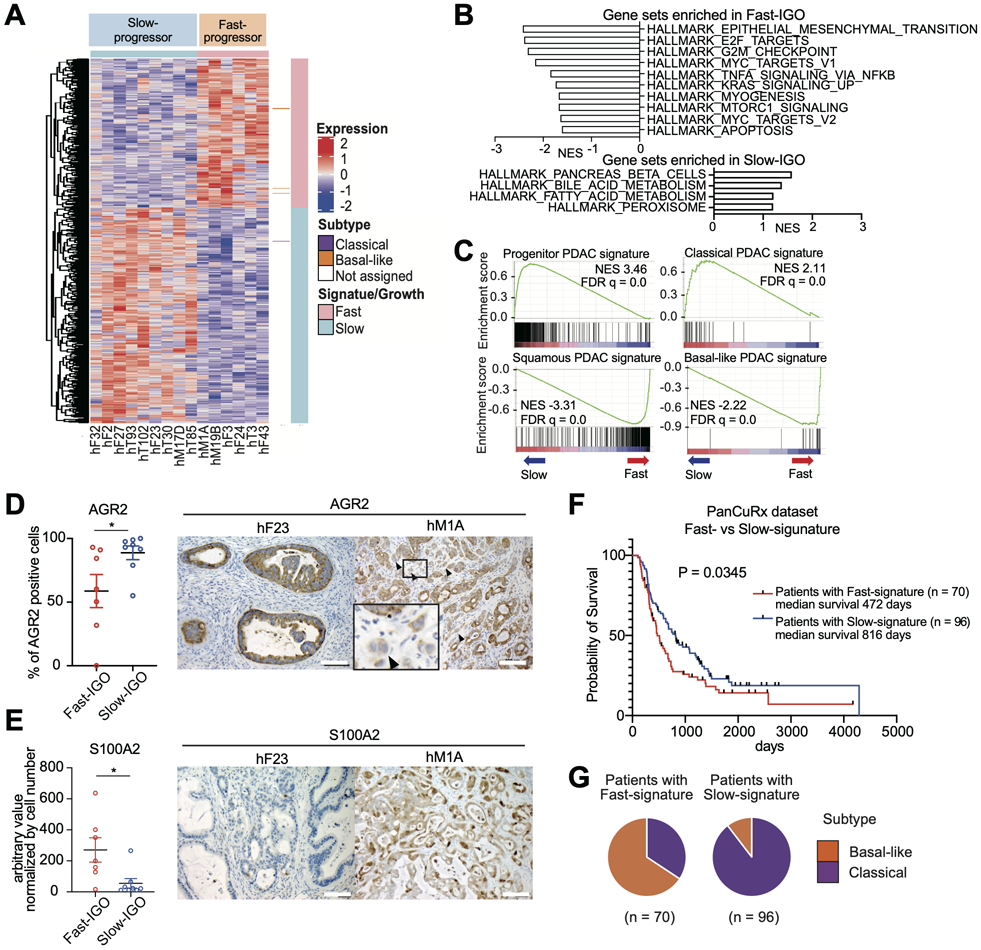
Figure 3. Fast progression to invasive carcinoma in the IGO model is correlated with a basal-like phenotype.

A) Heatmap of unbiased hierarchical clustering of expression levels of differentially expressed genes in Fast- relative to Slow-progressor IGO transplants of the indicated organoid lines. Pink and blue horizontal bar at the top indicates Fast- and Slow-progressor organoids, respectively. Pink and blue vertical bar indicates Fast- and Slow-progressor gene signatures, respectively. Purple and orange marks to the right of the heatmap indicate known classical and basal-like genes, respectively.
B) Hallmark pathways found significantly enriched by GSEA among genes differentially expressed in Fast- relative to Slow-progressor IGO tumors. Gene sets with high NES are shown. FDR q values of all gene sets are less than 0.25.
C) Enrichment of Progenitor PDAC signature (top left), Classical signature (top right), Squamous PDAC signature (bottom left) and Basal-like signature (bottom right) by GSEA among genes more highly expressed in Slow-progressors and Fast-progressors, respectively. NESs and FDR q values are shown.
D) Quantification of the percent of AGR2 positive cells in the IHC stains of Fast- and Slow-IGO transplants. Representative IHC images of IGO transplants of hF23 (left) and hM1A (right) at endpoint. Scale bars, 100 μm. Representative Data are means SEMs (n ≧ 3 fields of view). P value, unpaired Student’s t test.
E) Quantification of the percent of S100A2 positive cells in the IHC stains of Fast- and Slow-IGO transplants. Representative IHC images of IGO transplants of hF23 (left) and hM1A (right) at endpoint. Scale bars, 100 μm. Representative Data are means SEMs (n ≧ 3 fields of view). P value, unpaired Student’s t test.
F) Kaplan-Meier curve of percent overall survival based on PanCuRx data for patients found to express either the Fast-signature (red) or Slow-signature (blue). Median survival and log-rank (Mantel-Cox) test P value are shown.
G) Pie charts showing the percentage of PanCuRx patients whose tumors were classified as either classical (purple) or basal-like subtype (orange) for patients whose tumors expressed the Fast-signature (left) or Slow-signature (right).
