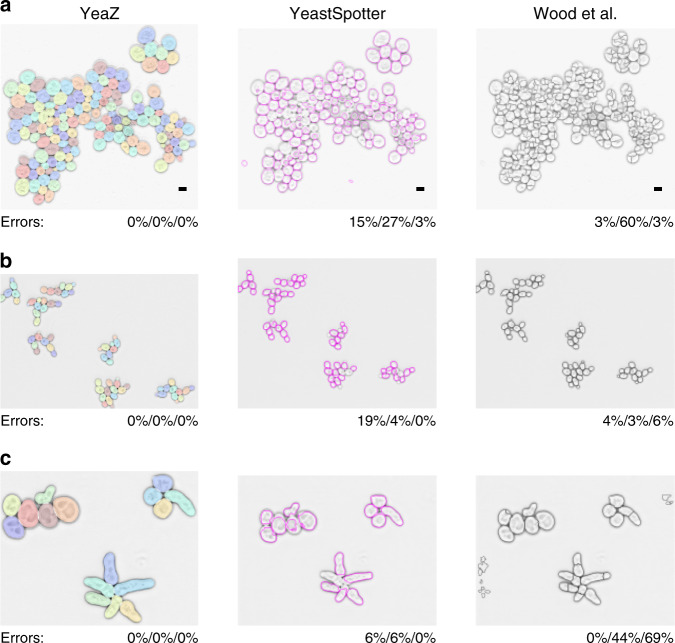
Fig. 4. Comparison of YeaZ with YeastSpotter and Wood et al.9.
a Image recorded by us but not included in the training set. b Image from ref. 16 showing cycling cells. c Image from ref. 16 showing pheromone-arrested cells. The error values represent the fraction of missed cells/of bad contours/and of spurious cells. Phase contrast images are inverted for better visualization. Scale bar in row a: 5 μm. Images in rows (b, c) from ref. 16, scale bar unknown.

