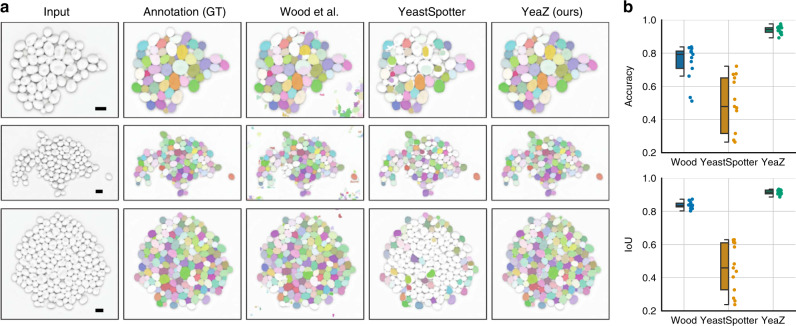
Fig. 5. Detailed computational comparison of all methods.
The evaluations were carried out on 17 test images of 1894 cycling wild-type cells not included in the YeaZ training set. a Each row shows an example test image, its ground-truth annotation (GT), and the result of Wood et al.9, YeastSpotter14, and YeaZ, respectively. b Quantification of segmentation performance of all methods. As is common in the computer vision literature, we call a predicted cell a true positive (TP), if its intersection over union (IoU) with the corresponding ground-truth (GT) cell is larger than or equal to 50%. Similarly, false positives (FPs) and false negatives (FNs) are defined as predictions that have no GT match and vice versa. As segmentation metric, we show the average accuracy () and average intersection-over-union of true positives (IoU). Boxes show interquartile ranges (IQR), lines signify medians, and whiskers extend to 1.5 IQR. Scale bar: 5 μm.

