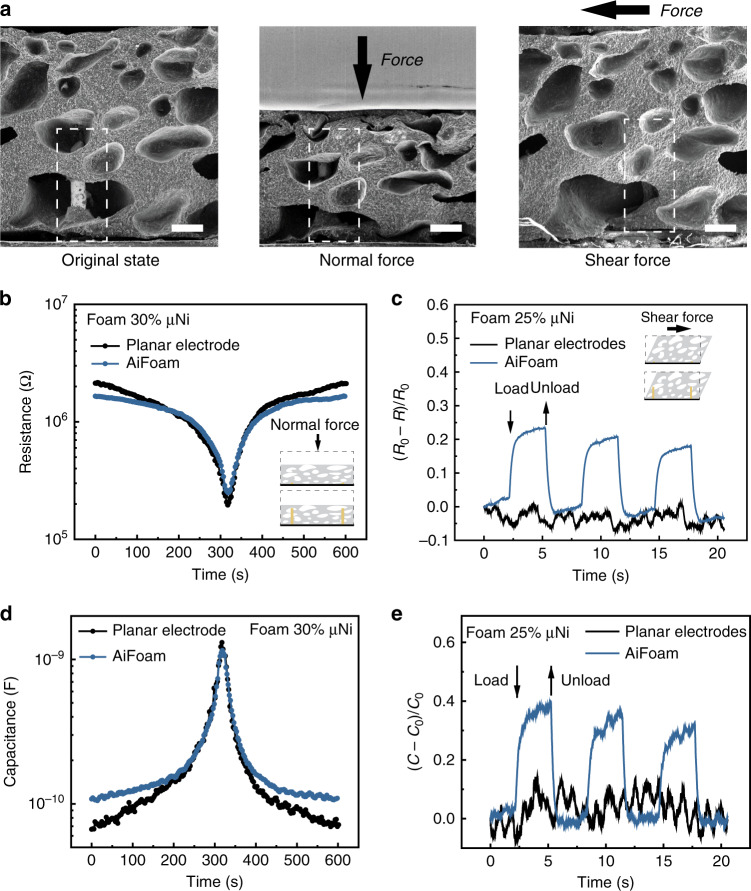
Fig. 2. Artificial innervation for normal and shear-force detection of AiFoam.
a SEM images of AiFoam sensor with 3D electrodes, revealing the original state (left), normal-force loading state (middle) and shear-force loading state (right), respectively. The black arrows represent the applied force directions. The dotted white boxes show the relative deformation of foam material to the 3D copper electrode. Scale bar: 200 μm. b Resistance and d capacitance responses on applying the normal force of 15 N to the Aifoam (with 30 vol% μNi) and control with 2D planar electrodes. Note that the data of b and d were simultaneously collected. c Resistance change and e capacitance change responses on applying the shear force to the AiFoam (with 25 vol% μNi) and control with 2D planar electrodes. Note that the data of c and e were simultaneously collected. R0 and C0 represent the initial resistance and capacitance of the sensor, whereas R and C represent the resistance and capacitance of the sensor during the pressure test.

