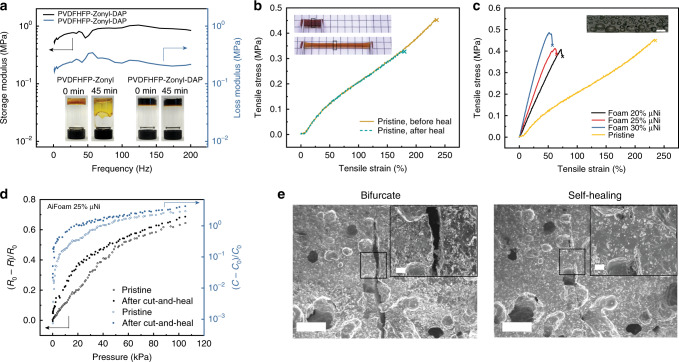
Fig. 3. Characterization of a low-modulus, elastic, and self-healing foam material.
a DMA result of the base polymer showing its viscoelasticity. PVDF-HFP-Zonyl represents the uncrosslinked material and PVDF-HFP-Zonyl-DAP represents the cross-linked material. Left insets (PVDF-HFP-Zonyl, 0 and 45 min) show the flowability of the material before crosslink. Right insets (PVDF-HFP-Zonyl-DAP, 0 and 45 min) show the solid-state material after crosslink. b Typical stress–strain curves of original and healed base elastomer material. The sample is bifurcated and then self-healed at 70 °C for 4 days. Top inset shows the self-healed sample at the original state. Bottom inset shows the self-healed sample being stretched. The dotted black boxes show the bifurcated and heal region on the sample. c Stress–strain curves of base elastomer and foam materials with different volume fractional μNi loadings. Inset: An optical image of the foam structure. Scale bar: 1 mm. d Graph shows the self-healing of piezoresistive and piezocapacitive behaviors of AiFoam (with 25 vol% μNi). R0 and C0 represent the initial resistance and capacitance of the sensor, whereas R and C represent the resistance and capacitance of the sensor during the pressure test. The data were simultaneously collected. e Cross-sectional SEM images reveal the self-healing performance of foam material; left bifurcated; right self-healed at 70 °C for 4 days. Insets: The zoom-in SEM images of the black boxes. Scale bar: 50 μm.

