Figure 2.
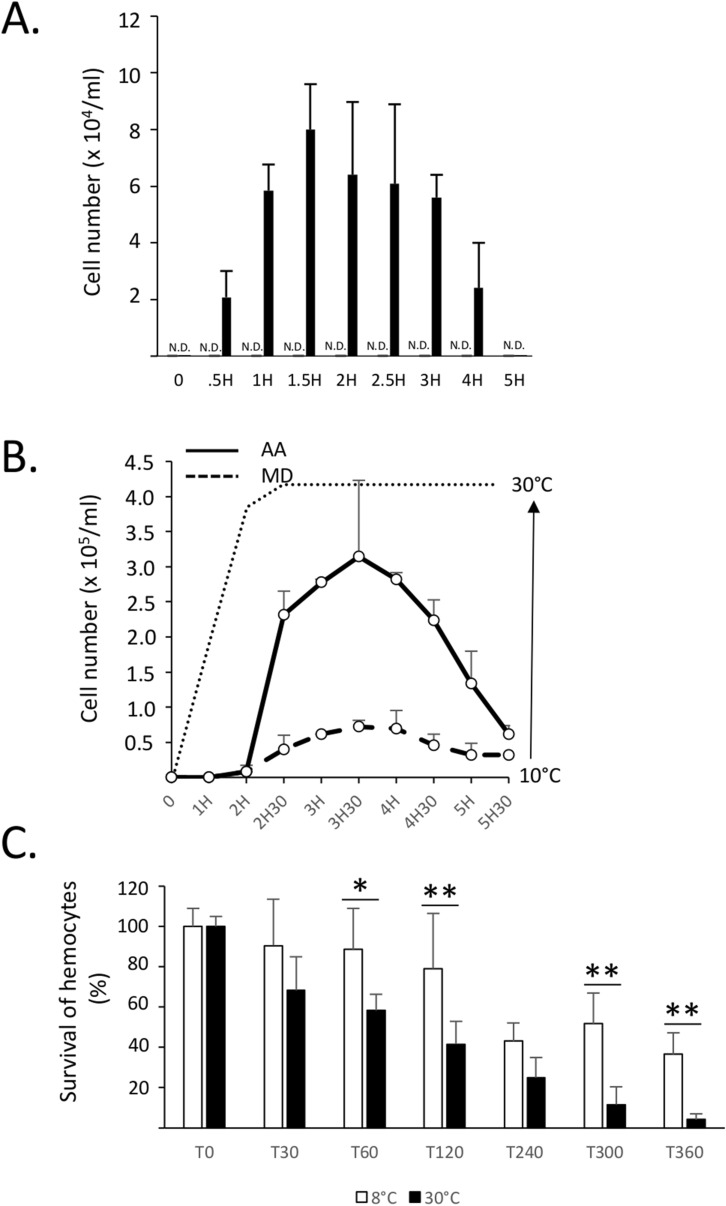
Release of hemocytes in seawater. (A) A. ater mussels (n = 6) were transferred in 1L tanks filled with seawater at 8 °C (grey bars) and 30 °C (black bars). At different times (minutes) post-transfer, aliquots (triplicates) of 0.5 ml of seawater were collected, centrifuged at low speed for 10 min at room temperature and resuspended in 50 μl of seawater before measuring cell counts in an hemacytometer by standard trypan blue exclusion method. These results are representative of three independent experiments. N.D. not detectable. (B) Comparative analysis of the number of viable hemocytes released in seawater by M. desolationis (MD) and A. ater (AA) (n = 10/group) after a progressive increase of temperature. The x axis indicates the times (hours) at which hemocytes were collected. The dotted line does represents the temperature (°C) at different times when hemocytes were collected. (C) Kinetics of survival of hemocytes of A. ater of in seawater at different times (min) after addition in tanks containing seawater at 8° and 30 °C. Each time point represents the mean of triplicates. Data are representative of two independent experiments.

