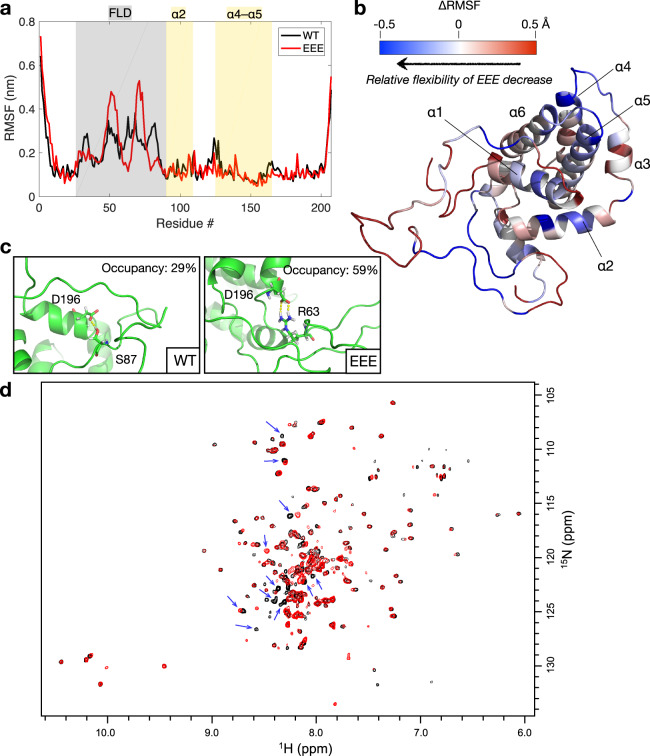
Fig. 4. MD simulations and NMR of BCL-2 structure dynamics.
a Per-residue RMSF result of the MD simulations (see also Supplementary Fig. 5). Segments corresponding to the FLD, α2, and α4–α5 are highlighted. b Cartoon illustration of the ΔRMSF results, calculated by RMSFEEE−RMSFWT. ΔRMSF < 0 (in blue) indicates a decrease in the structural flexibility as compared to WT. c Two hydrogen bonds can be observed in the MD trajectories. d The overlaid 2D 1H–15N TROSY-HSQC spectra acquired from EEE (black) and WT (red) at 298 K. Blue arrows indicate the differences caused by Gly residues and several residues in the un-structured region.

