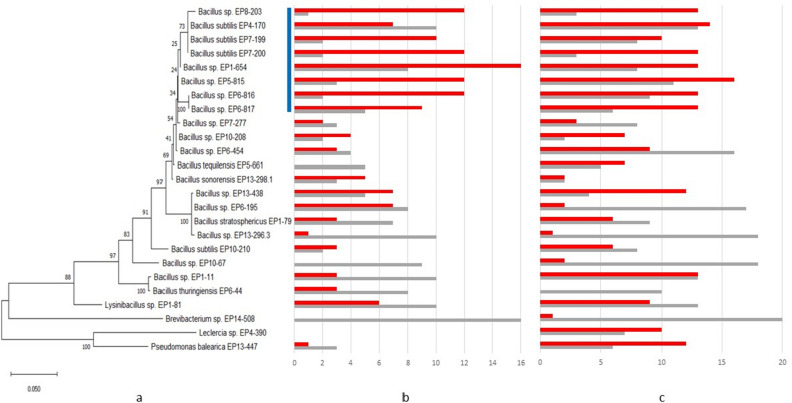
Figure 3.
Phylogenetic tree and the activity/sensitivity profile of the 25 high competitor strains. (a) Phylogenetic tree based on 16S rRNA gene sequences. (b) Activity/sensitivity profile of the strains, which were cultivated in the medium they were originally isolated from. Therefore, different media were used. (c) All strains fermented in ISP2 medium supplemented with NaCl. The bar diagram indicates for each strain how many competitors were inhibited (red) and by how many itself was inhibited (grey). The blue bar indicates the branch of high competitors. Bootstrap values are given at the branches of the phylogenetic tree.

