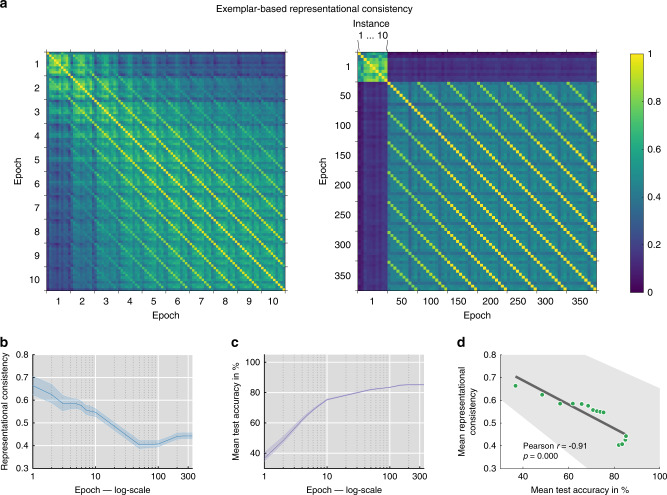
Fig. 9. Final-layer representational consistency (exemplar-based) across training epochs.
a Comparing representational consistency across early epochs [1 to 10] (left) and throughout all training epochs [1 to 350 in steps of 50] (right). Lines parallel to the main diagonal indicate that network instances remain on their distinct representational trajectory compared to other networks. Average consistency shown across 45 network pairs, derived from 10 network instances. b Representational consistency, computed and averaged across all network pairs (45 pairs total) for each training epoch, demonstrates increasing individual differences with training (shown with 95% CI). c Test performance across training (average top-1 accuracy across 10 network instances with 95% CI). d Representational consistency and test performance exhibit a strong negative relationship (Pearson r = −0.91, p < 0.001; robust correlation) indicating that task training enhances individual differences (dots represent network training epochs, error bar indicates 95% CI).

