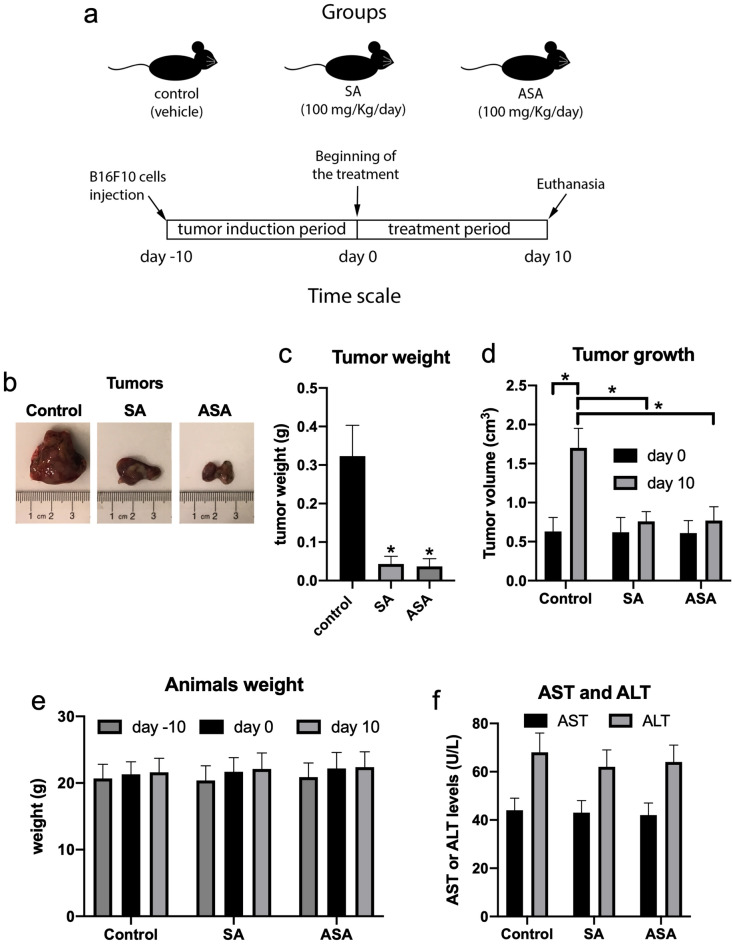
Figure 2.
The anticancer effects of SA and ASA on a murine model of implanted melanoma. Panel a: design of the animal protocol. Panel b: representative pictures of the tumors extracted from untreated animals and those treated with SA or ASA. Panels c and d: tumors weight and tumors growth, respectively, comparing the control treatment with SA and ASA treatments. Panel e: average values for the mice body weight during the treatment. Panel f: average values for the activity of the liver enzymes AST and ALT in the serum of the animals. Values are mean ± S.E.M. of 8 different animals in each group (n = 8). * means P < 0.05 as compared to the control (One-way ANOVA followed by Dunnett post-test).

