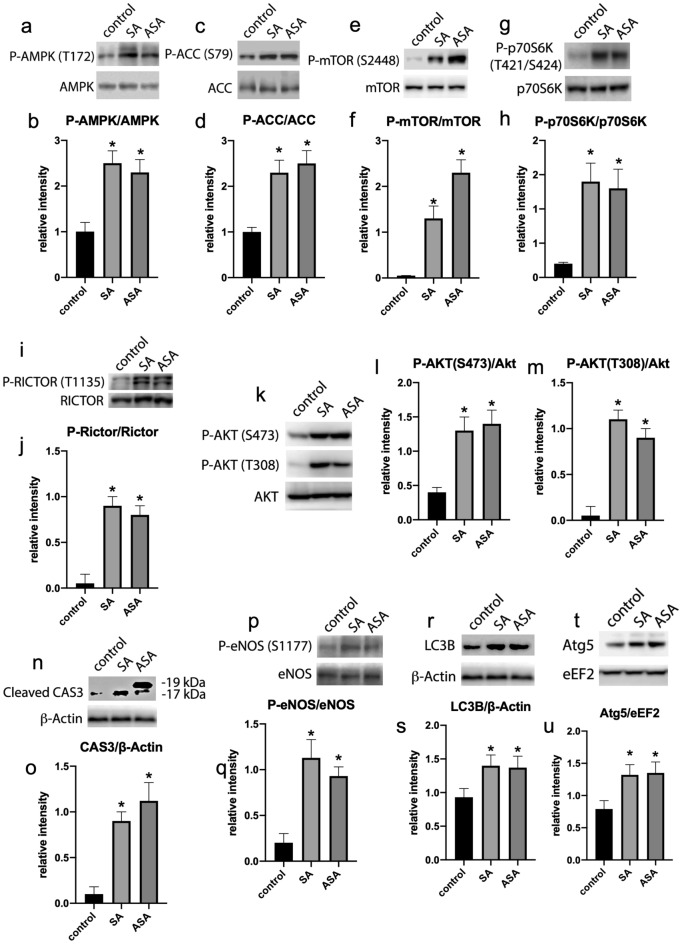
Figure 3.
Signaling pathways profiles in the tumors extracted from animals treated or not with SA or ASA. Western blots displayed are the whole processed strips, as indicated in “Material and methods” and are representative samples of each group and represented in the graphics as mean ± S.E.M. of 8 different animals (n = 8). Panels a and b: AMPK and phospho-AMPK (T172). Panels c and d: ACC and phospho-ACC (S79). Panels e and f: mTOR and phospho-mTOR (S2448). Panels g and h: p70S6K and phospho-p70S6K (T421/S424). Panels i and j: Rictor and phospho-Rictor (T1135). Panels k, l, and m: Akt and phospho-Akt (T308 or S473). Panels n and o: cleaved CAS3 and ß-Actin (Different exposition periods for cleaved CAS3 are presented in supplementary material, Fig. S3). Panels p and q: eNOS and phospho-eNOS (S1177). Panels r and s: LC3B and ß-Actin. Panels t and u: Atg5 and eEF2. *Means P < 0.05 as compared to the control (One-way ANOVA followed by Dunnett post-test).

