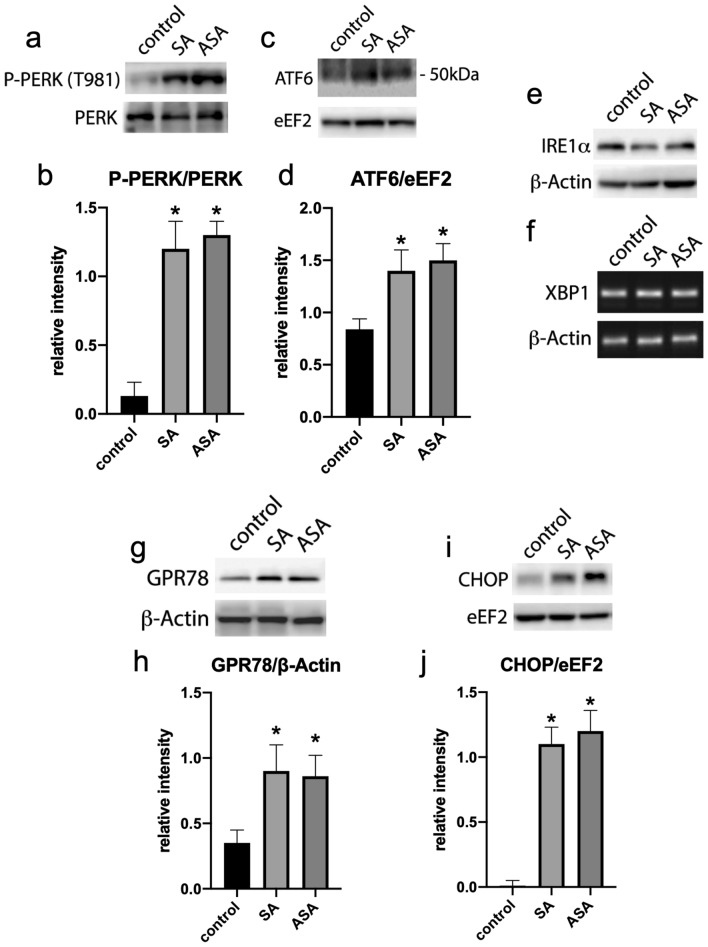
Figure 4.
ER stress response evaluation in the tumors extracted from animals treated or not with SA or ASA. Western blots displayed are the whole processed strips, as indicated in “Material and methods” and are representative samples of each group and represented in the graphics as mean ± S.E.M. of 8 different animals (n = 8). Panels a and b: PERK and phospho-PERK (T981). Panels c and d: ATF6 and eEF2. Panel e: IRE1α. Panel f: XBP1. Panels g and h: GPR78 and ß-Actin. Panels i and j: CHOP and eEF2. *means P < 0.05 as compared to the control (One-way ANOVA followed by Dunnett post-test).

