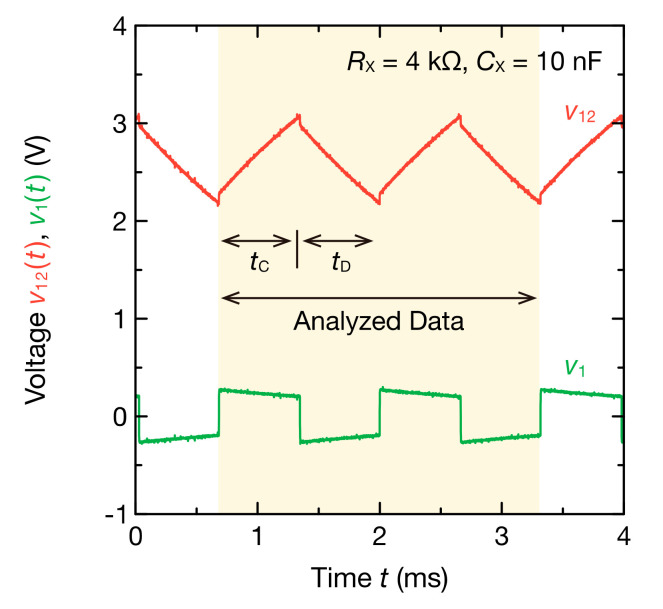
Figure 3.
Example of the oscillation waveforms of and measured in the circuit of Figure 2b. The and were set to 4.0 kΩ and 10 nF, respectively. The segment of time with a colored background corresponds to two cycles of the oscillation and was used for the subsequent discrete Fourier transform (DFT) analysis.

