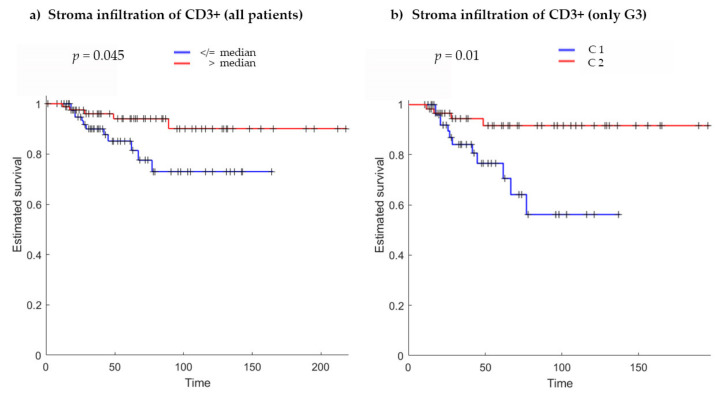
Figure 1.
Kaplan–Meier curves for (a) stromal infiltration of CD3+ immune cells (all patients) using the median (2882 cells/mm2) as threshold to divide patients into two groups (p = 0.045). (b) Stromal infiltration of CD3+ immune cells (only in G3 subgroup) using the k-means clustering approach (p = 0.01). C1 with low and C2 with high immune cell infiltration. In each graph, Kaplan–Meier curves present a significant difference between the two groups, showing an increased survival in patients with higher immune cell infiltration. p-Values are calculated using the log-rank test; x-axis, survival in months; y-axis, estimated survival (fraction of individuals).

