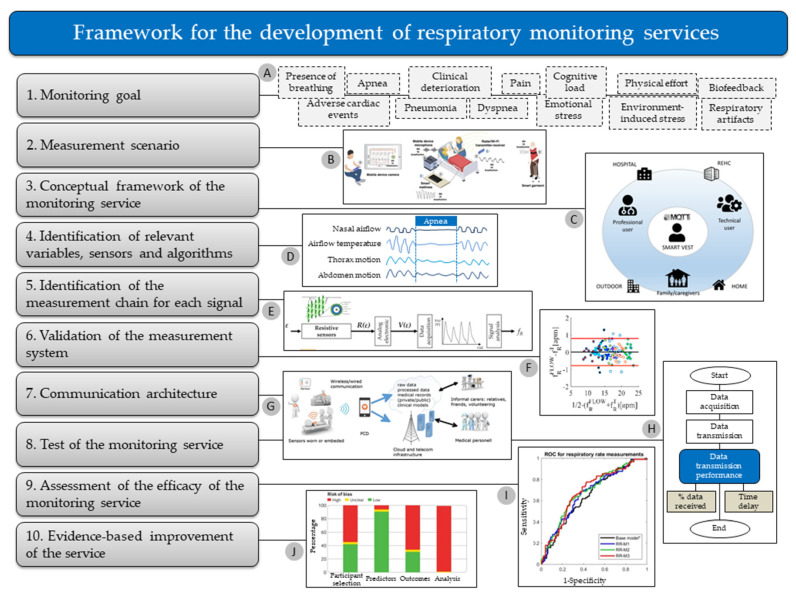
Figure 4.
A conceptual framework for the development of respiratory monitoring services. The framework is composed of ten steps that are numbered and listed on the left-hand side of the figure. Each of the ten steps is accompanied by a graphical example reported on the right-hand side of the figure. Panel (A) reports the thirteen monitoring goals described in this review. The graph in panel (B) is reproduced from Massaroni et al. [5]. The graph in panel (C) is reproduced from Naranjo-Hernández et al. [157]. Panel (D) provides an example of the output of some of the sensors used to detect apnea events in sleep laboratories. The graph in panel (E) is slightly modified from Massaroni et al. [24]. The graph in panel (F) is slightly modified from Lo Presti et al. [290]. The graph in panel (G) is reproduced from Tomasic et al. [293]. Panel (H) provides an example of data transmission performance evaluation. The graph in panel (I) is slightly modified from Quinten et al. [116]. The graph in panel (J) is slightly modified from Gerry et al. [110].

