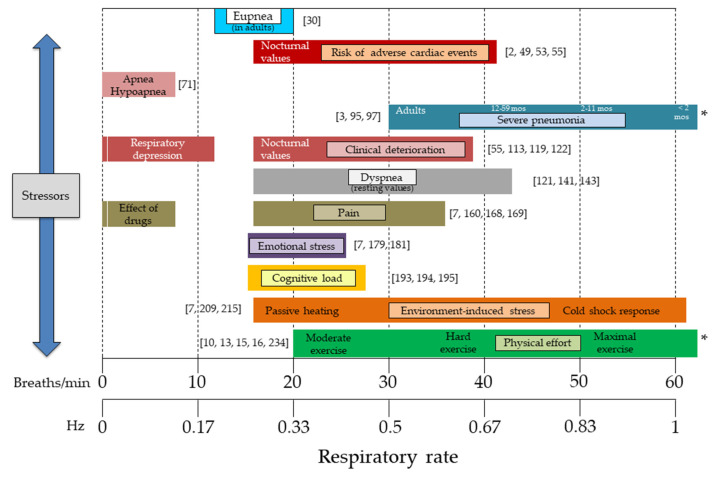
Figure 5.
Schematic representation of how respiratory rate (values expressed both in breaths/min and in Hz) may change in response to different stressors. The range of respiratory rate values reported for each stressor has been defined according to the cited references (numbers in square brackets), but these values should only be considered as plausible examples. fR values refer to adults if not otherwise stated. * it is not unusual to observe fR values higher than 65 breaths/min. Mos, months.

