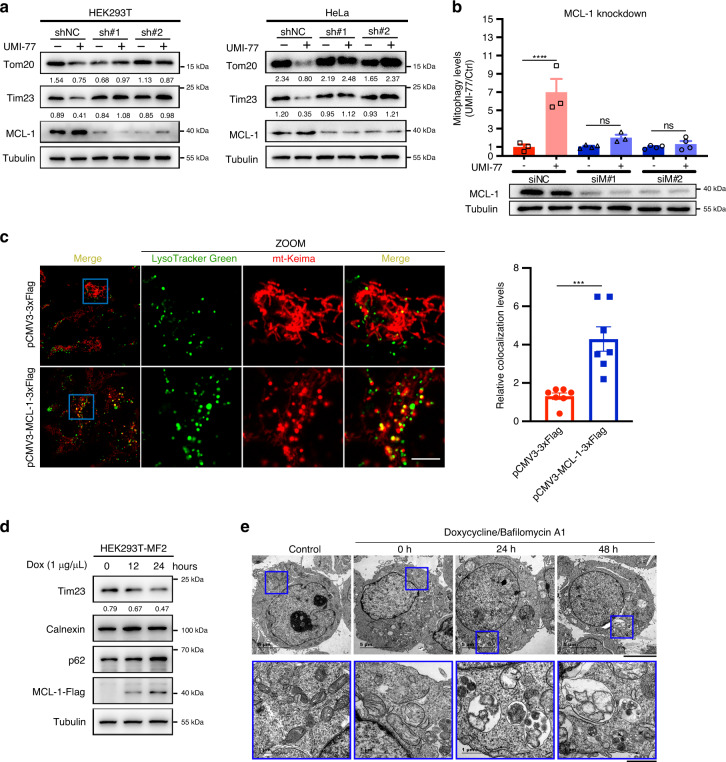
Fig. 2. MCL-1 promotes mitophagy and is required for UMI-77-induced mitophagy.
a HEK293T cells were transfected with MCL-1 shRNA for 60 h and treated with 5 µM UMI-77 for 12 h. Cell lysates were immunoblotted for mitochondrial marker proteins (Tom20, Tim23). The numbers under the blots represent the gray scale quantification (Tom20/Tubulin, Tim23/Tubulin). shNC: scrambled shRNA. b HEK293T-mt-Keima cells were transfected with indicated siRNA for 60 h, treated with UMI-77 (5 µM) for 12 h, The siRNA knockdown efficiency was shown using western blot and the mitophagy levels were quantified. One-way ANOVA (data represent mean ± S.E.M.; n = 3. ****p < 0.0001, ns, not significant.). siNC: scrambled siRNA. c HEK293T-mt-Keima cells were transfected with pCMV3-MCL-1-3xFlag and pCMV3-3xFlag plasmid, for 24 h, stained with LysoTracker Green for 30 min and imaged using fluorescence microscopy. Scale bar, 5 µm. Quantification of the number of LysoTracker-positive dots colocalized with mt-Keima in cells were analyzed by two-tailed t test. (data represent mean ± S.E.M.; n = 7 ***p < 0.001 (P = 0.0007)). d MCL-1-expressing HEK293T-MF2 cells were treated with 1 μg/mL doxycycline (Dox) for the indicated times, cell lysates were immunoblotted with indicated antibodies. The numbers under the blot represent the gray scale quantification (Tim23/Tubulin). e HEK293T-MF2 cells were treated with 1 μg/mL doxycycline for the indicated times, treated with Bafilomycin A1 for 6 h, and analyzed by transmission electron microscopy (TEM). Insets (blue boxes) show mitochondria and the autophagosomes engulfing mitochondria. Scale bars, 5 µm; insets: Scale bar, 1 μm. Source data are provided as a Source Data file.

