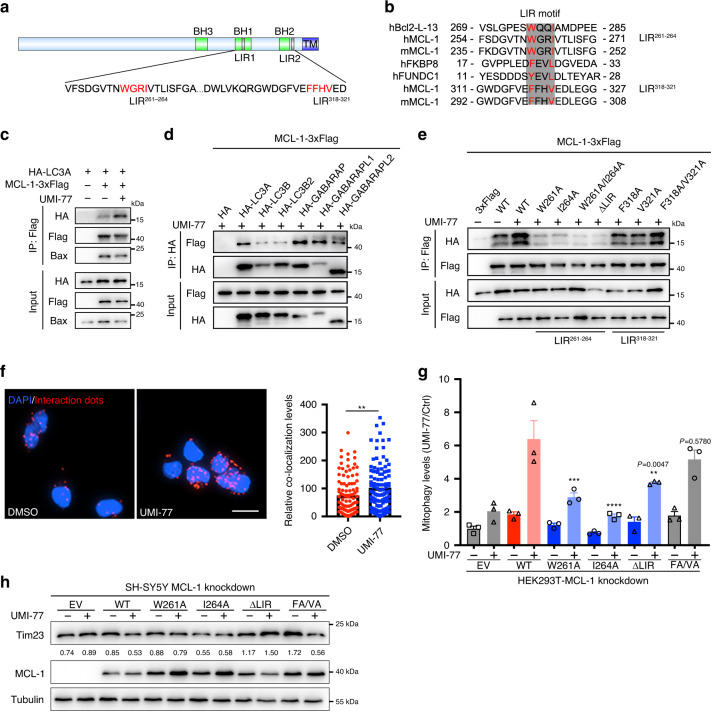
Fig. 3. The interaction between MCL-1 and LC3A is required for UMI-77-induced mitophagy.
a The schematic diagram of MCL-1 protein indicating two potential LIR (LC3-interacting region) motifs. The image was created by us in this study. b The alignment of LIR sequences of MCL-1, Bcl-2-L-13, FKBP8, and FUNDC1. Red sequences indicate highly conserved residues in LIR motif. h: Human; m: Mouse. The image was created by us in this study. c HEK293T cells were co-transfected with MCL-1-3xFlag and HA-LC3A for 24 h, treated with UMI-77 (10 µM) for 4 h, and the interaction of MCL-1 with HA-LC3A and endogenous Bax was analyzed by immunoprecipitation. d HEK293T cells were co-transfected with MCL-1-3xFlag and HA-tagged Atg8 family proteins for 24 h, treated with UMI-77 (10 µM) for 4 h, and the interaction between MCL-1 and the Atg8 family proteins was analyzed by immunoprecipitation. e HEK293T cells were co-transfected with MCL-1-3xFlag WT or the indicated mutants and LC3A-HA for 24 h, treated with UMI-77 (10 µM) for 4 h, and the interactions were analyzed by immunoprecipitation. f PLA assay for endogenous MCL-1 and LC3A was performed in HEK293T cells treated with UMI-77 (10 µM) for 4 h. Scale bar, 20 μm. Graph on the right–quantification of the PLA dots (data represents mean ± S.E.M.; DMSO (n = 107 cells), UMI-77 (n = 115 cells), **p < 0.01 (P = 0.0065), two-tailed t test). g HEK293T-MCL-1-konckdown cell were co-transfected MCL-1 WT or indicated mutants with mt-Keima plasmid for 48 h, treated with UMI-77 (5 µM) for 12 h. The mitophagy levels were quantified by one-way ANOVA (data represent mean ± S.E.M.; n = 3, ****p < 0.0001, ***p < 0.001, **p < 0.01, ns, not significant.). h SH-SY5Y MCL-1-knockdown cell line was transfected with expression plasmids encoding MCL-1 WT or indicated mutants and treated with UMI-77 (5 µM) for 12 h. The numbers under the blots represent the gray scale quantification (Tim23/Tubulin). Source data are provided as a Source Data file.

