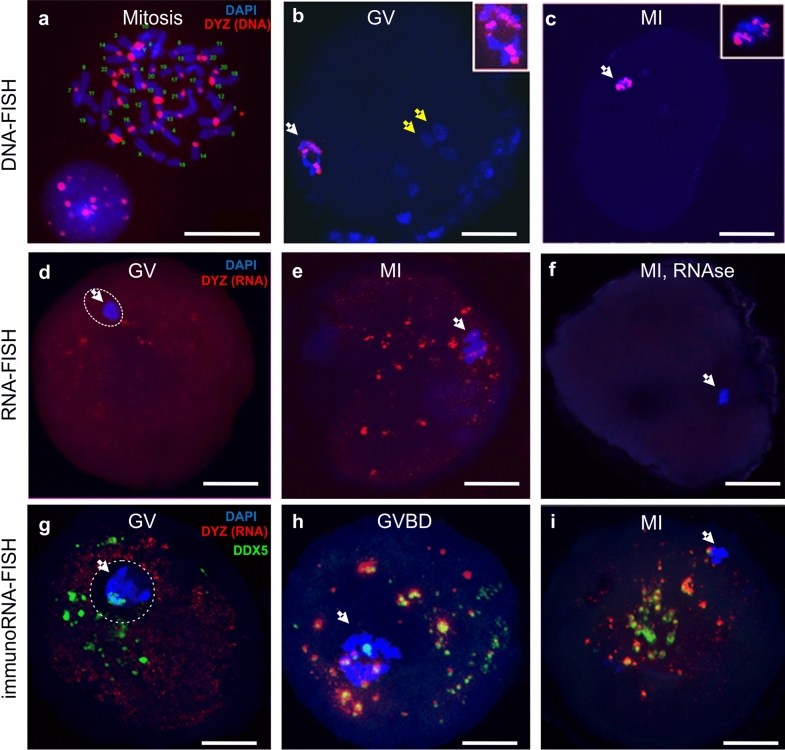
Figure 1.
Spatial distribution of HS2/HS3 DNA (a–c), RNA (d–f), and a helicase, DDX5, relative to HS2/HS3 RNA (g–i) in human germinal vesicle (GV) and metaphase I (MI) oocytes. (a–c) Localization of HS2/HS3 DNA probed with DYZ1 (red) in metaphase spreads of human lymphocytes (a), in human GV (b) and MI (c) oocytes as revealed by DNA–DNA FISH; (d–f) localization of HS2/HS3 RNA probed with DYZ1 (red) in human GV (d) and MI (e,f) oocytes, as revealed by DNA–RNA FISH without (d,e) and with (f) RNase A treatment; (g–i) localization of the HS3 transcript probed with DYZ1 (red) and DDX5 RNA helicase (green) in GV oocytes (g); during the transition from GV to MI (h); and at the MI stage (i). White arrows—(b,d,g) a ring of highly condensed heterochromatin, (c,e,f,h,i) a metaphase plate. Yellow arrows—(b) cumulus cells. Inserts show (b) the heterochromatin ring and (c) the metaphase plate. The nucleus was encircled with dotted white line (d,g) after the merge with brightfield data (not included in the panel). Chromatin was counterstained with DAPI (blue). Scale bars: (5 μm) (A) and (50 μm) (b–i).

