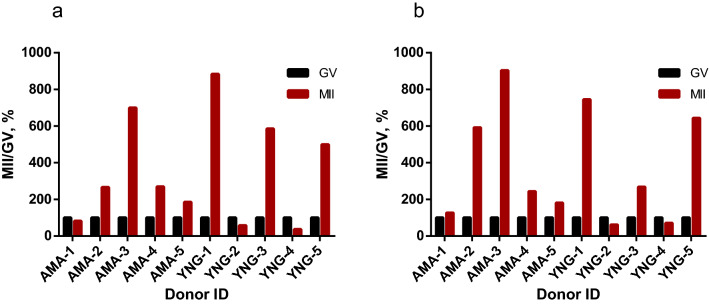
Figure 4.
Computational analysis of HS2/HS3 transcripts quantity in GV and MII individual oocyte transcriptomes published by Reyes et al.22. (a) TPM calculated for transcripts clustered using UCLUST (see “Materials and methods”); (b) Total TPM of three already-known HS2/HS3 sequences: X60726.1, S90110.1, X82942.1. The already-known sequences were taken as references to compare their TPM value with the TPM value of clustered transcripts shown in (a). X-axis, donor ID as shown in the publication. Y-axis, percentage of HS2/HS3 TPM in MII (GV HS2/HS3 TPM value is set to 100% in each GV–MII pair from the same donor). The absolute clusters’ TPM values are given in Supplementary Table 2.

