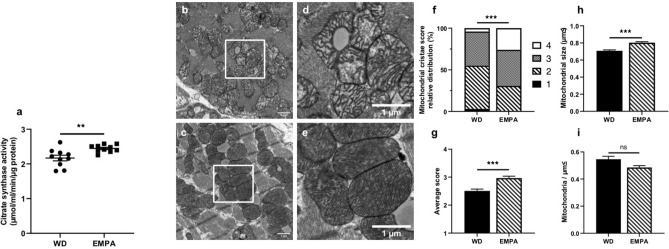
Figure 2.
EMPA treatment induces changes in mitochondrial mass, morphology and size (a) Citrate synthase activity was measured using a photometric kinetic assay (n = 10). Representative transmission electron microscopy (TEM) images of left ventricular cardiac tissue of untreated (b and d) and EMPA treated mice (c and e). Scale bar = 1 µm, n = 3. Relative distribution (f) and average score (g) of mitochondrial cristae score (see Supplementary Fig. 2 for details). (h) Average size in µm2 of a single mitochondrium. (i) mitochondrial density as expressed in mitochondria per µm2. Data are expressed as means ± SEM, ***p < 0.001, **p < 0.01, n.s. = not significant. WD, Western type diet only; EMPA, Western type diet enriched with empagliflozin.

