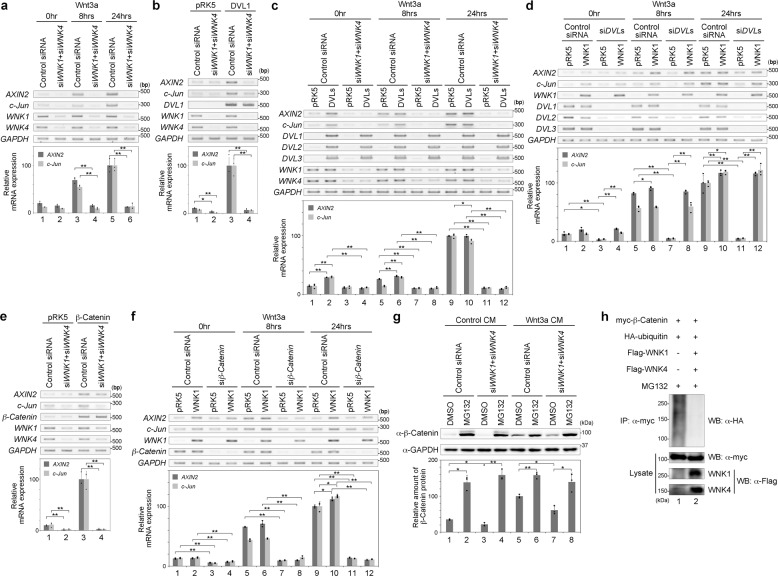
Fig. 1. WNK is a positive regulator of the Wnt signalling pathway.
a Gene expression was examined by RT-PCR or quantitative RT-PCR in HEK293T cells following Wnt stimulation or the knockdown of both WNK1 and WNK4. n = 3 biologically independent experiments. Dots indicate individual data. b Gene expression was examined by RT-PCR or quantitative RT-PCR in HEK293T cells following the expression of DVL1 or knockdown of both WNK1 and WNK4. n = 3 biologically independent experiments. Dots indicate individual data. c Gene expression was examined by RT-PCR or quantitative RT-PCR in HEK293T cells following the treatment with Wnt3a stimulation, the expression of DVL1, DVL2 and DVL3, or knockdown of both WNK1 and WNK4. n = 3 biologically independent experiments. Dots indicate individual data. d Gene expression was examined by RT-PCR or quantitative RT-PCR in HEK293T cells following Wnt stimulation of the expression of WNK1 or knockdown of DVL1, DVL2 and DVL3. n = 3 biologically independent experiments. Dots indicate individual data. e Gene expression was examined by RT-PCR or quantitative RT-PCR in HEK293T cells following the expression of β-Catenin or knockdown of both WNK1 and WNK4. n = 3 biologically independent experiments. Dots indicate individual data. f Gene expression was examined by RT-PCR or quantitative RT-PCR in HEK293T cells following Wnt stimulation, the expression of WNK1 or knockdown of β-Catenin. n = 3 biologically independent experiments. Dots indicate individual data. g Western blot analysis of endogenous protein expression following Wnt stimulation, the knockdown of both WNK1 and WNK4, or MG132 (10 μM, 6 h) treatment in HEK293T cells. n = 3 biologically independent experiments. Dots indicate individual data. h Western blot analysis of ubiquitinated β-Catenin under the expression of WNK1 and WNK4 in HEK293T cells. Values and error bars express mean ± standard deviation (SD). * indicates p < 0.05 and ** indicates p < 0.005. p value was calculated by Bonferroni test.

