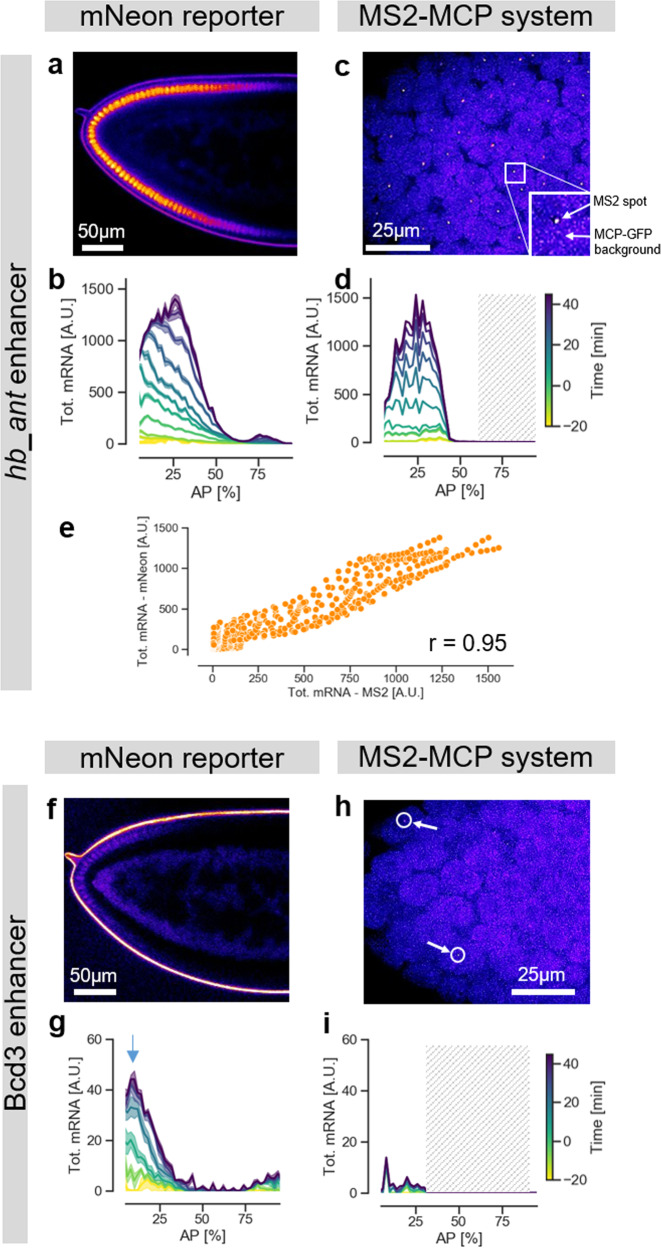
Fig. 2. The mNeonGreen reporter detects weaker expression patterns than the MS2 system.
a Confocal slice of the anterior region of an hb_ant-mNeonRep embryo, showing mNeonGreen fluorescence in false colors b Cumulative mRNA production patterns at different times of embryo development measured with the mNeonGreen reporter. c Confocal slice of the anterior region of a hb_ant-DSCP-MS2-yellow embryo, MCP-GFP fluorescence represented in false colors. d Cumulative mRNA production patterns for the hb_ant enhancer as a function of AP position, measured with the MS2-MCP system. Since the field of view is limited to about 30% of the embryo, data were pooled from two independent experiments, focusing on the regions 0–30 and 30–60% AP, respectively. The shaded area represents a region of the embryo for which no data was collected. e Comparison of the cumulative mRNA production patterns measured with the mNeonRep and MS2-MCP reporter systems, at all times and positions. r = Pearson’s correlation coefficient. f Confocal slice of the anterior region of a Bcd3-mNeonRep embryo, showing mNeonGreen fluorescence in false colors (g) Cumulative mRNA production patterns (maximum production level indicated by an arrow) at different times of embryo development measured with the mNeonGreen reporter. h Confocal slice of the anterior tip of a Bcd3-DSCP-MS2-yellow embryo, MCP-GFP fluorescence represented in false colors. The arrows indicate exemplary fluorescent spots. i Cumulative mRNA production patterns for the Bcd3 enhancer as function of AP position, measured with the MS2 system.

