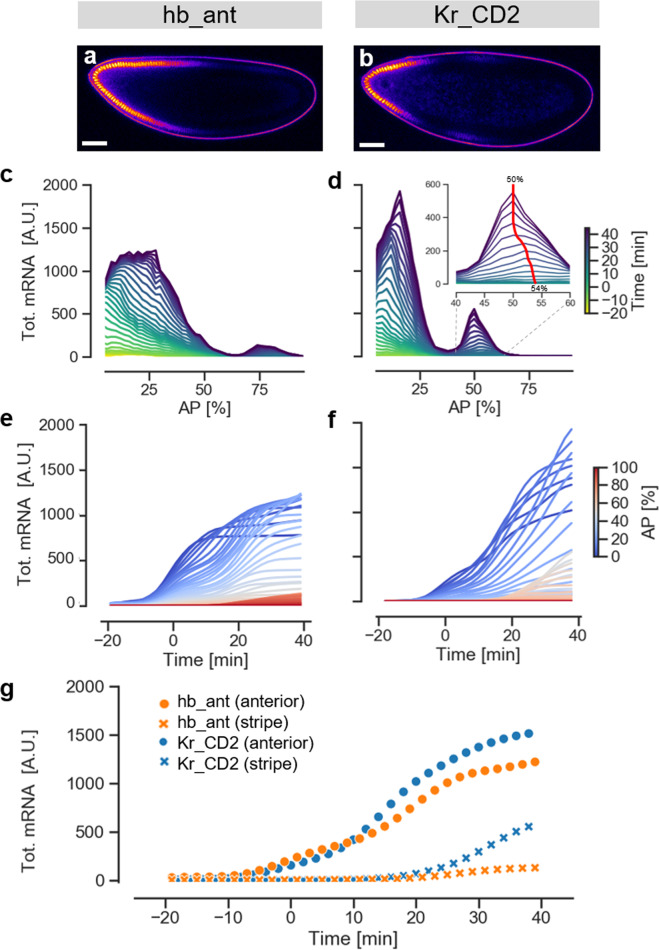
Fig. 3. Activity and dynamics of embryos carrying native Drosophila enhancers using the mNeon reporter system.
a and b. Confocal fluorescence sections of hb_ant and Kr_CD2 embryos just before gastrulation. c and d. total mRNA levels along the AP axis over time. Averages from three replicates of each enhancer. The inset in (d) zooms in on the evolution of the central stripe of the Kr_CD2 enhancer. The red line highlights the dynamic shift of the position of the expression peak. e and f. Total mRNA levels as a function of time, with AP position color-coded as indicated. Averages from three replicates of each enhancer. g Temporal dynamics for the anterior domain (dots) and the posterior/central stripe (crosses) of the two enhancers.

