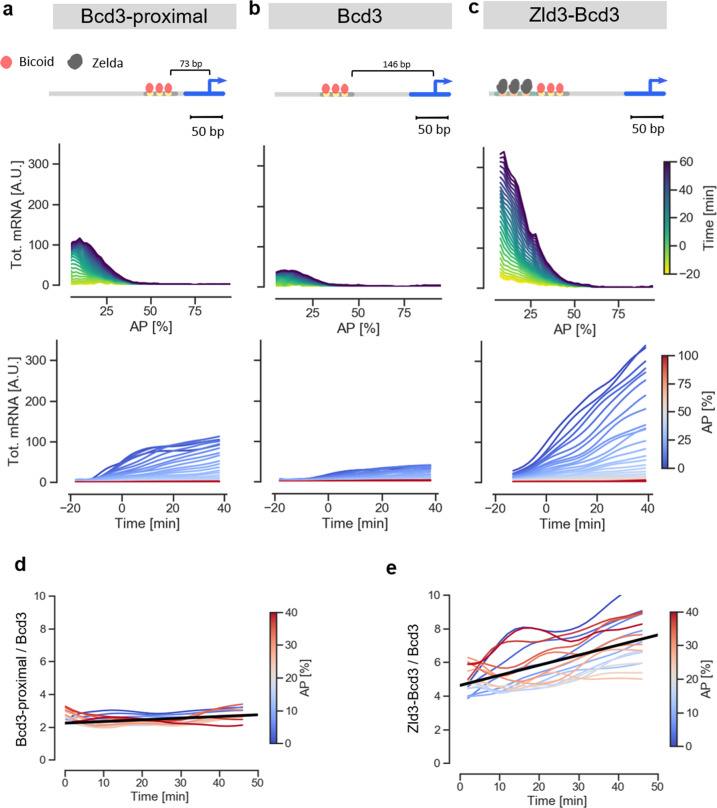
Fig. 4. Applying the mNeonGreen reporter to measure transcriptional dynamics of synthetic enhancers.
a–c Dynamics of the activity of the Bcd3-proximal, Bcd3 and Zld3Bcd3 enhancers, respectively. From top to bottom: sketch of enhancer architectures, illustrating arrangement of binding sites and distance from TSS. Cumulative mRNA production patterns along the AP axis, color coded by the time of embryo development (average of 3 biological replicates). Time course of cumulative mRNA production, color coded by position along the AP axis (average of 3 biological replicates). d Ratio of the cumulative mRNA production for Bcd3-proximal and Bcd3 enhancers as a function of time, color coded by the position along the AP axis. e Ratio of the cumulative mRNA production for Zld3Bcd3 and Bcd3 enhancers as a function of time, color coded by the position along the AP axis.

