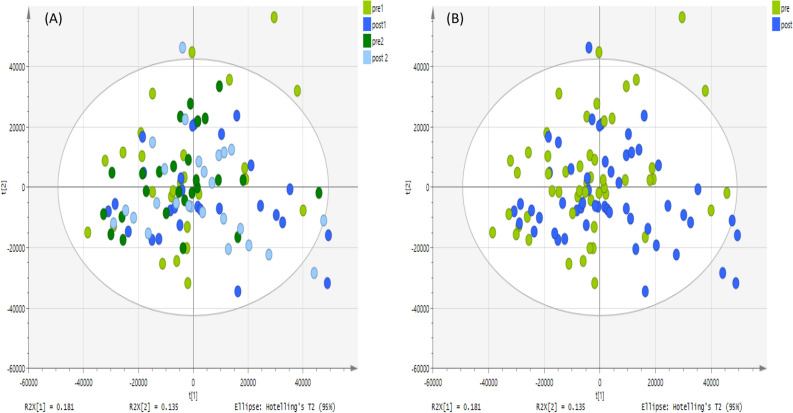
Figure 3.
PCA score plot. It shows groups of saliva samples based on 331 putative metabolites analyzed on a ZIC-pHILIC column. The data was Pareto scaled. (A) Green and light green are controls; pre-training for both day 1 and 2 respectively (n = 26 of each day), and blue and light blue are treated; post-training for both day 1 and 2 respectively (n = 26 of each day), (B) green is control; pre-training for both day 1 and 2 respectively (n = 52) and blue is treated; post-training for both day 1 and 2 respectively (n = 52).

