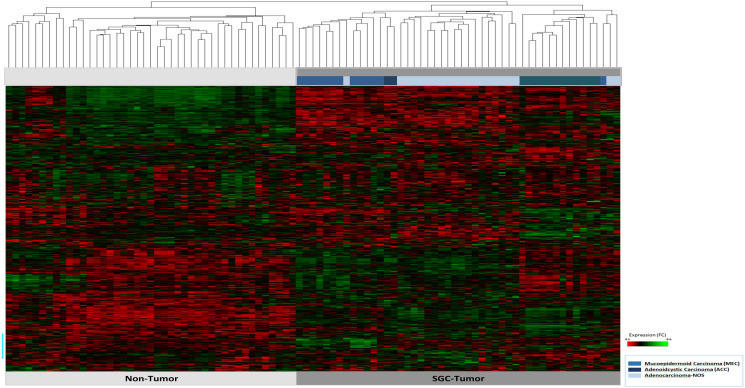
Figure 1. Hierarchical cluster analysis of all 47 patient samples of tumor tissue (n = 47) and corresponding non-tumor tissue (n = 47).
The tumor and non-tumor samples (n = 94) are arranged on the x-axis, the transcript assignment on the y-axis. The entities are differentiated by the bars in blue tones (see legend). A high gene expression is shown in the heatmap red, a downregulated expression in green.

