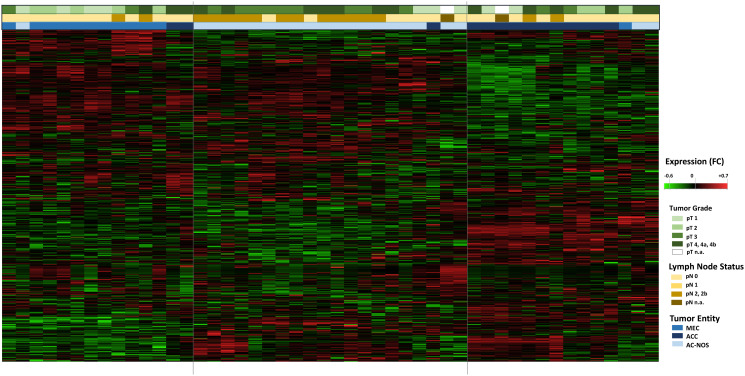
Figure 2. Hierarchical cluster Heatmap Analysis of tumor entities with tumor growth (pT) and lymphogenic metastasis (pN): All tumor samples of the 47 patients are shown (n = 47, x-axis).
The transcript assignment is on the y-axis. The upper color bars represent the tumor size (pT, in green tones), the pathological lymph node status (pN, in brown tones) and the tumor entities (in blue tones). An increased gene expression is shown in the heatmap red, a decreased gene expression in green.

