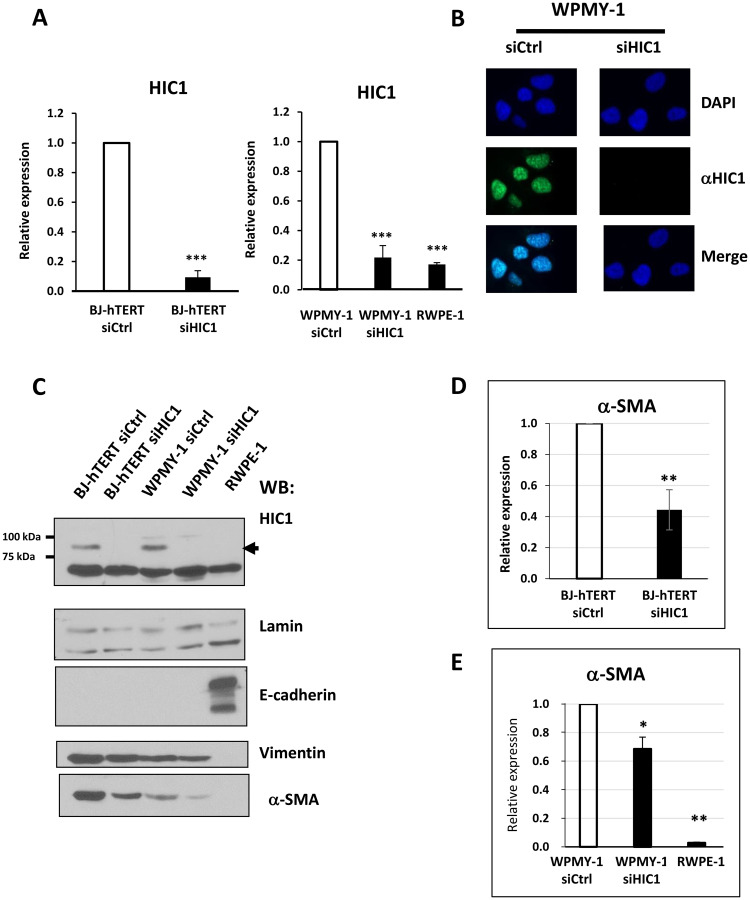
Figure 6. Analyses of HIC1 expression in the myofibroblastic cell line WPMY-1 compared to the epithelial cell line RWPE1.
(A) The global expression level of HIC1 expression was examined by RT-qPCR analyses in two normal immortalized cell lines derived from the same histologically normal prostate [27]: the prostate epithelial cell line, RWPE1 and the stromal myofibroblastic cell line WPMY-1. BJ-hTERT fibroblasts, used as control, and WPMY-1 cells were transfected with the indicated siRNAs. RNAs and total cell extracts (used in Panels C and D) were simultaneously prepared from these cells. (B) Immunofluorescence analyses of WPMY-1 cells. WPMY-1 cells transfected with the indicated siRNAs were fixed with paraformaldehyde and analyzed by conventional immunofluorescence microscopy using the monoclonal anti-HIC1 antibody (H-6). Nuclei are seen as DAPI-positive staining. The merging of the two images is shown in the two bottom panels. (C) Detection of endogenous HIC1 proteins by Western blot analyses. Total cell extracts were immunoblotted with the monoclonal anti-HIC1 (H-6) antibodies (upper panels). Immunoblotting with anti-Lamin A antibodies was used as a loading control. E-cadherin and Vimentin or α-SMA were used as markers of epithelial and fibroblastic cells, respectively. (D and E) α-SMA expression is reduced upon HIC1 knockdown in BJ-hTERT fibroblasts and in WPMY-1 fibroblasts, respectively. α-SMA mRNA levels were analyzed by RT-qPCR in the RNA samples used in panel (A) for HIC1.

