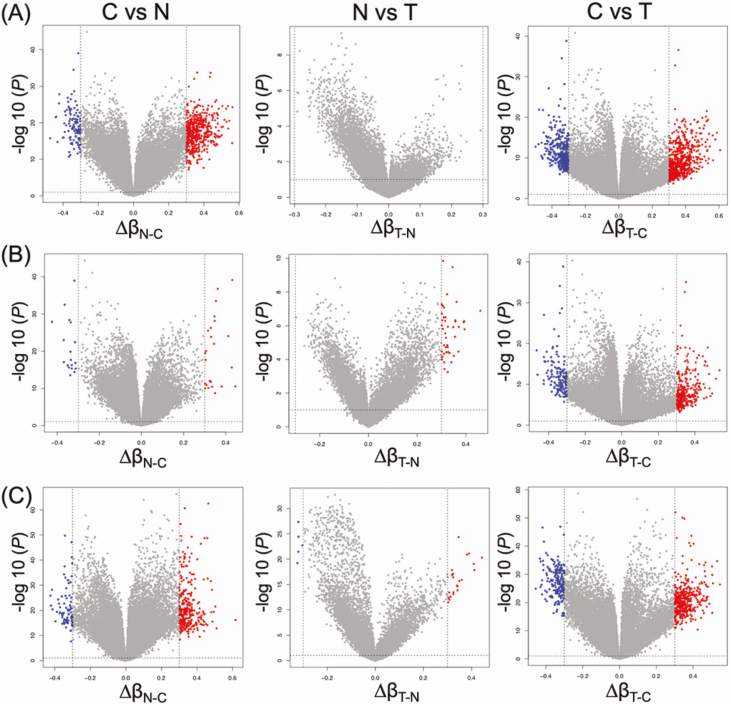
Figure 1.
Volcano plots of probes showing DNA hypermethylation (P < 0.05 after Bonferroni correction and ∆β ≥ 0.3; red) and DNA hypomethylation (P < 0.05 after Bonferroni correction and ∆β ≤ −0.3; blue) based on Infinium assay in Clusters A (n = 20) (A), B1 (n = 20) (B) and B2 (n = 69) (C). Probes shown by red or blue are listed in Supplementary Tables S2–S4, available at Carcinogenesis Online.

