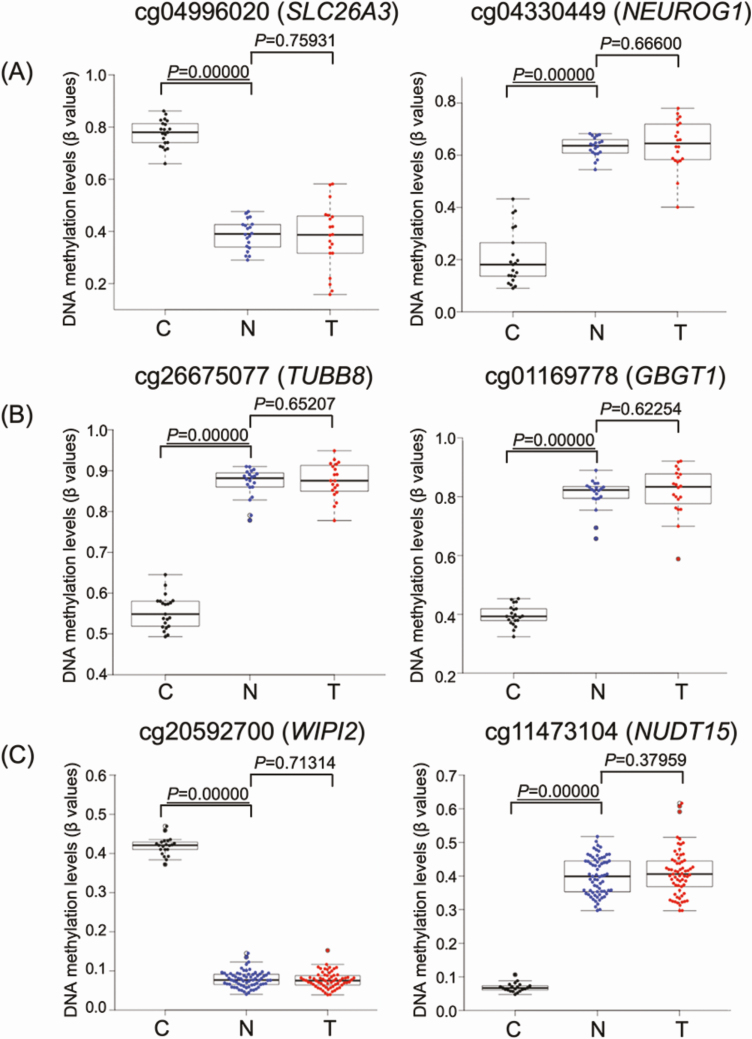
Figure 2.
DNA methylation levels of representative genes in normal control gastric mucosa (C; black), non-cancerous gastric mucosa (N; blue) and cancerous tissue (T; red) samples in Clusters A (n = 20) (A), B1 (n = 20) (B) and B2 (n = 69) (C). Infinium probe ID and gene names are shown at the top of each panel. DNA methylation alterations actually occurred at the precancerous N stages compared with C samples and such alterations were inherited by the T samples themselves. P values less than 0.05 have been underlined (Welch’s T-test).

